Building a NLP model to predict Disaster Tweets
Business Scenario
Twitter has become an essential platform where people share real-time information during emergencies. However, tweets can sometimes use dramatic language in a figurative way, making it challenging for machines to determine if a tweet is reporting a real disaster. To address this, we use a dataset of 10,000 labeled tweets from a Kaggle competition. These tweets have been manually classified as either related to real disasters or not. The model learns from this data to automatically classify new tweets. We are building a machine learning model to predict which Tweets are about real disasters and which ones are not. The end goal is to help disaster relief organizations, emergency services, and news agencies quickly filter relevant tweets during crisis situations.
Techniques
- Data visualization (Seaborn, Matplotlib)
- Tokenization and padding (Keras tokenizer and sequences)
- Pre-trained word embeddings (GloVe)
- Deep learning model with LSTM
- Model checkpointing and validation monitoring
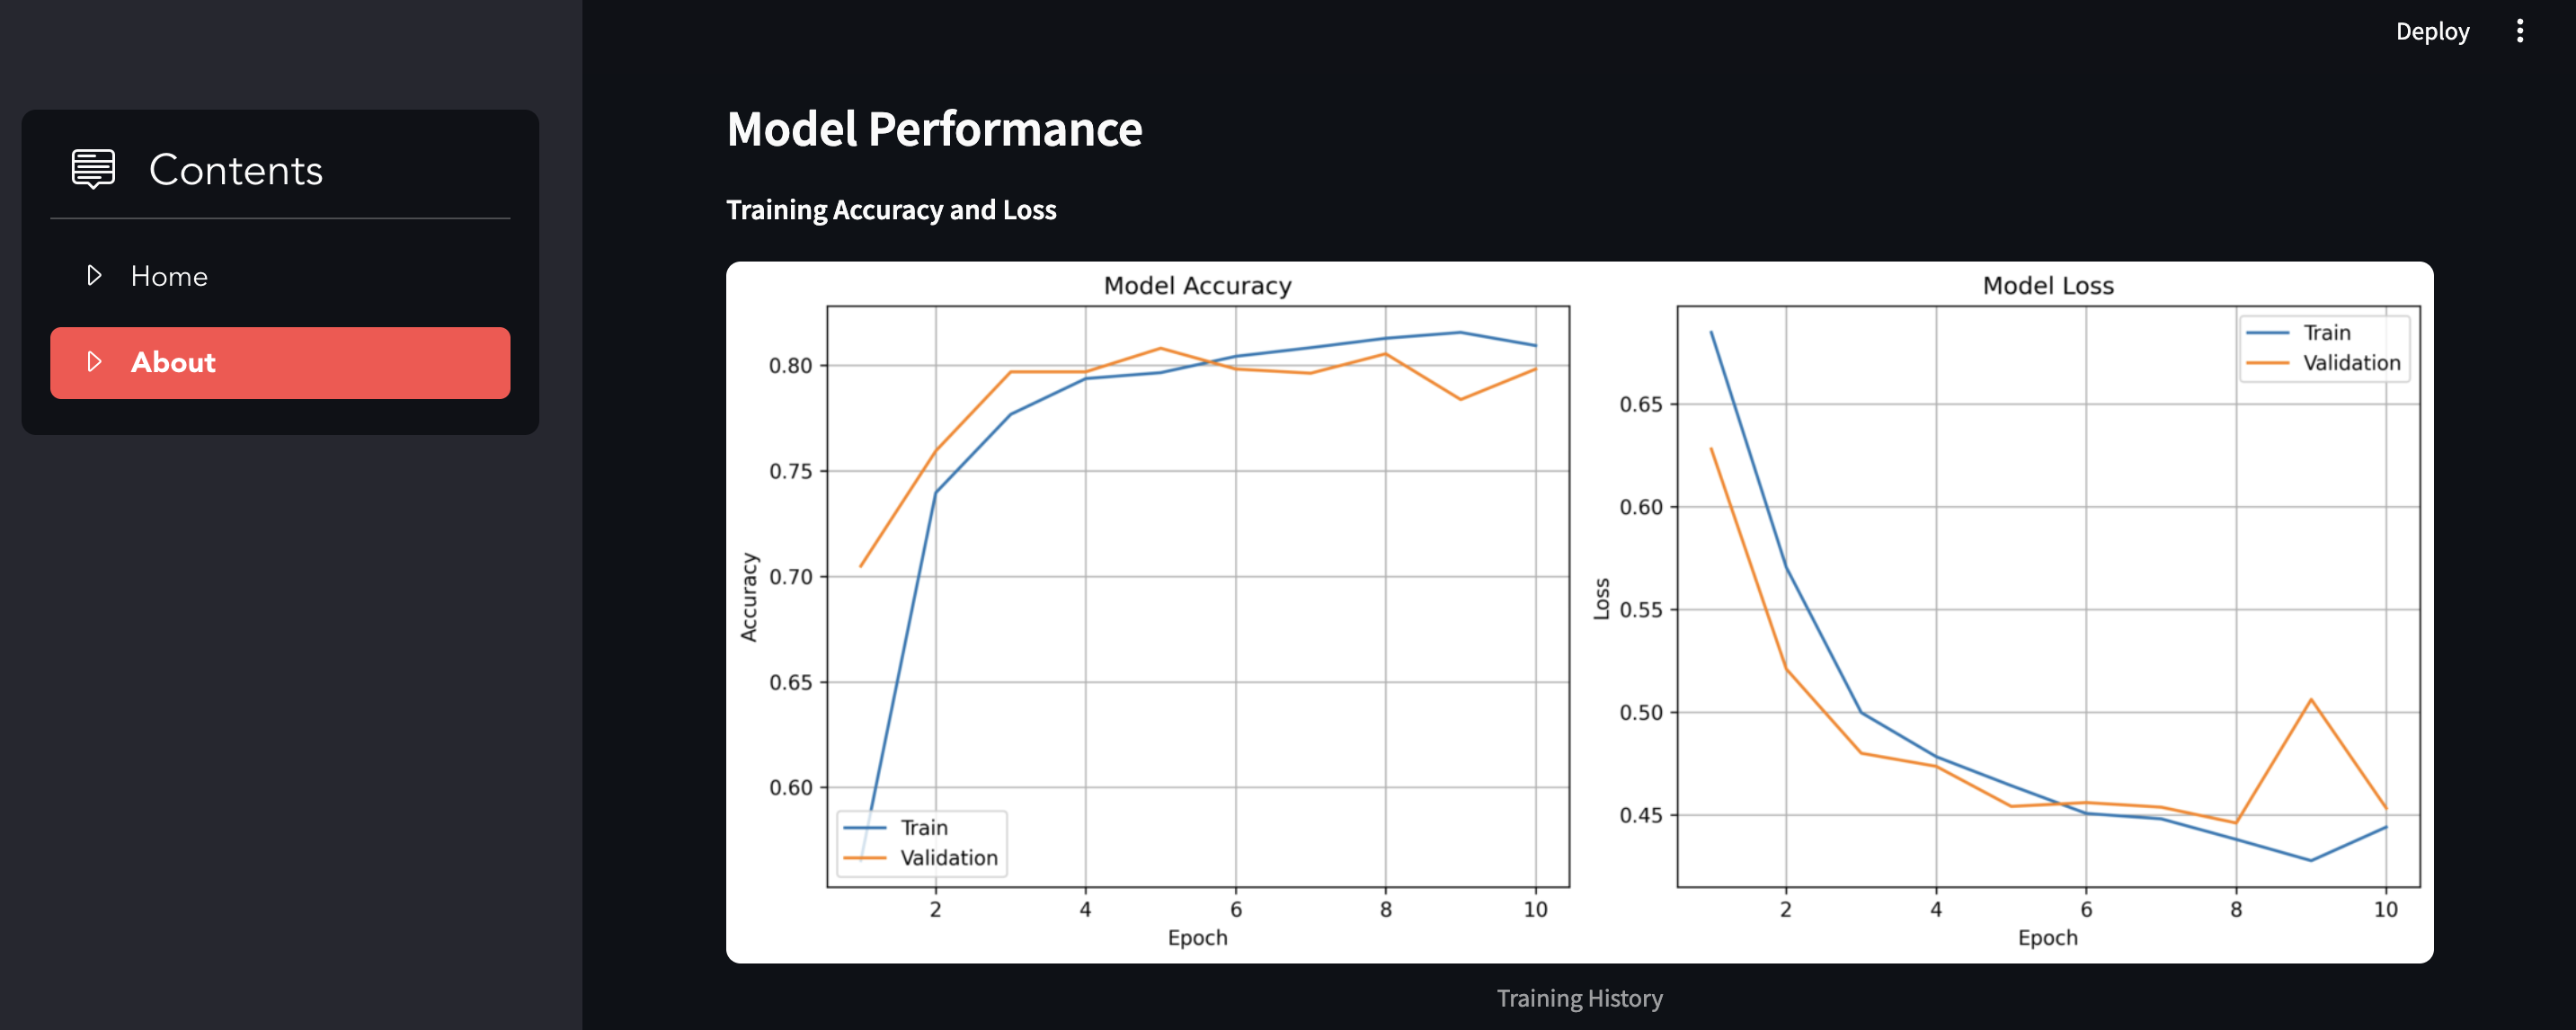
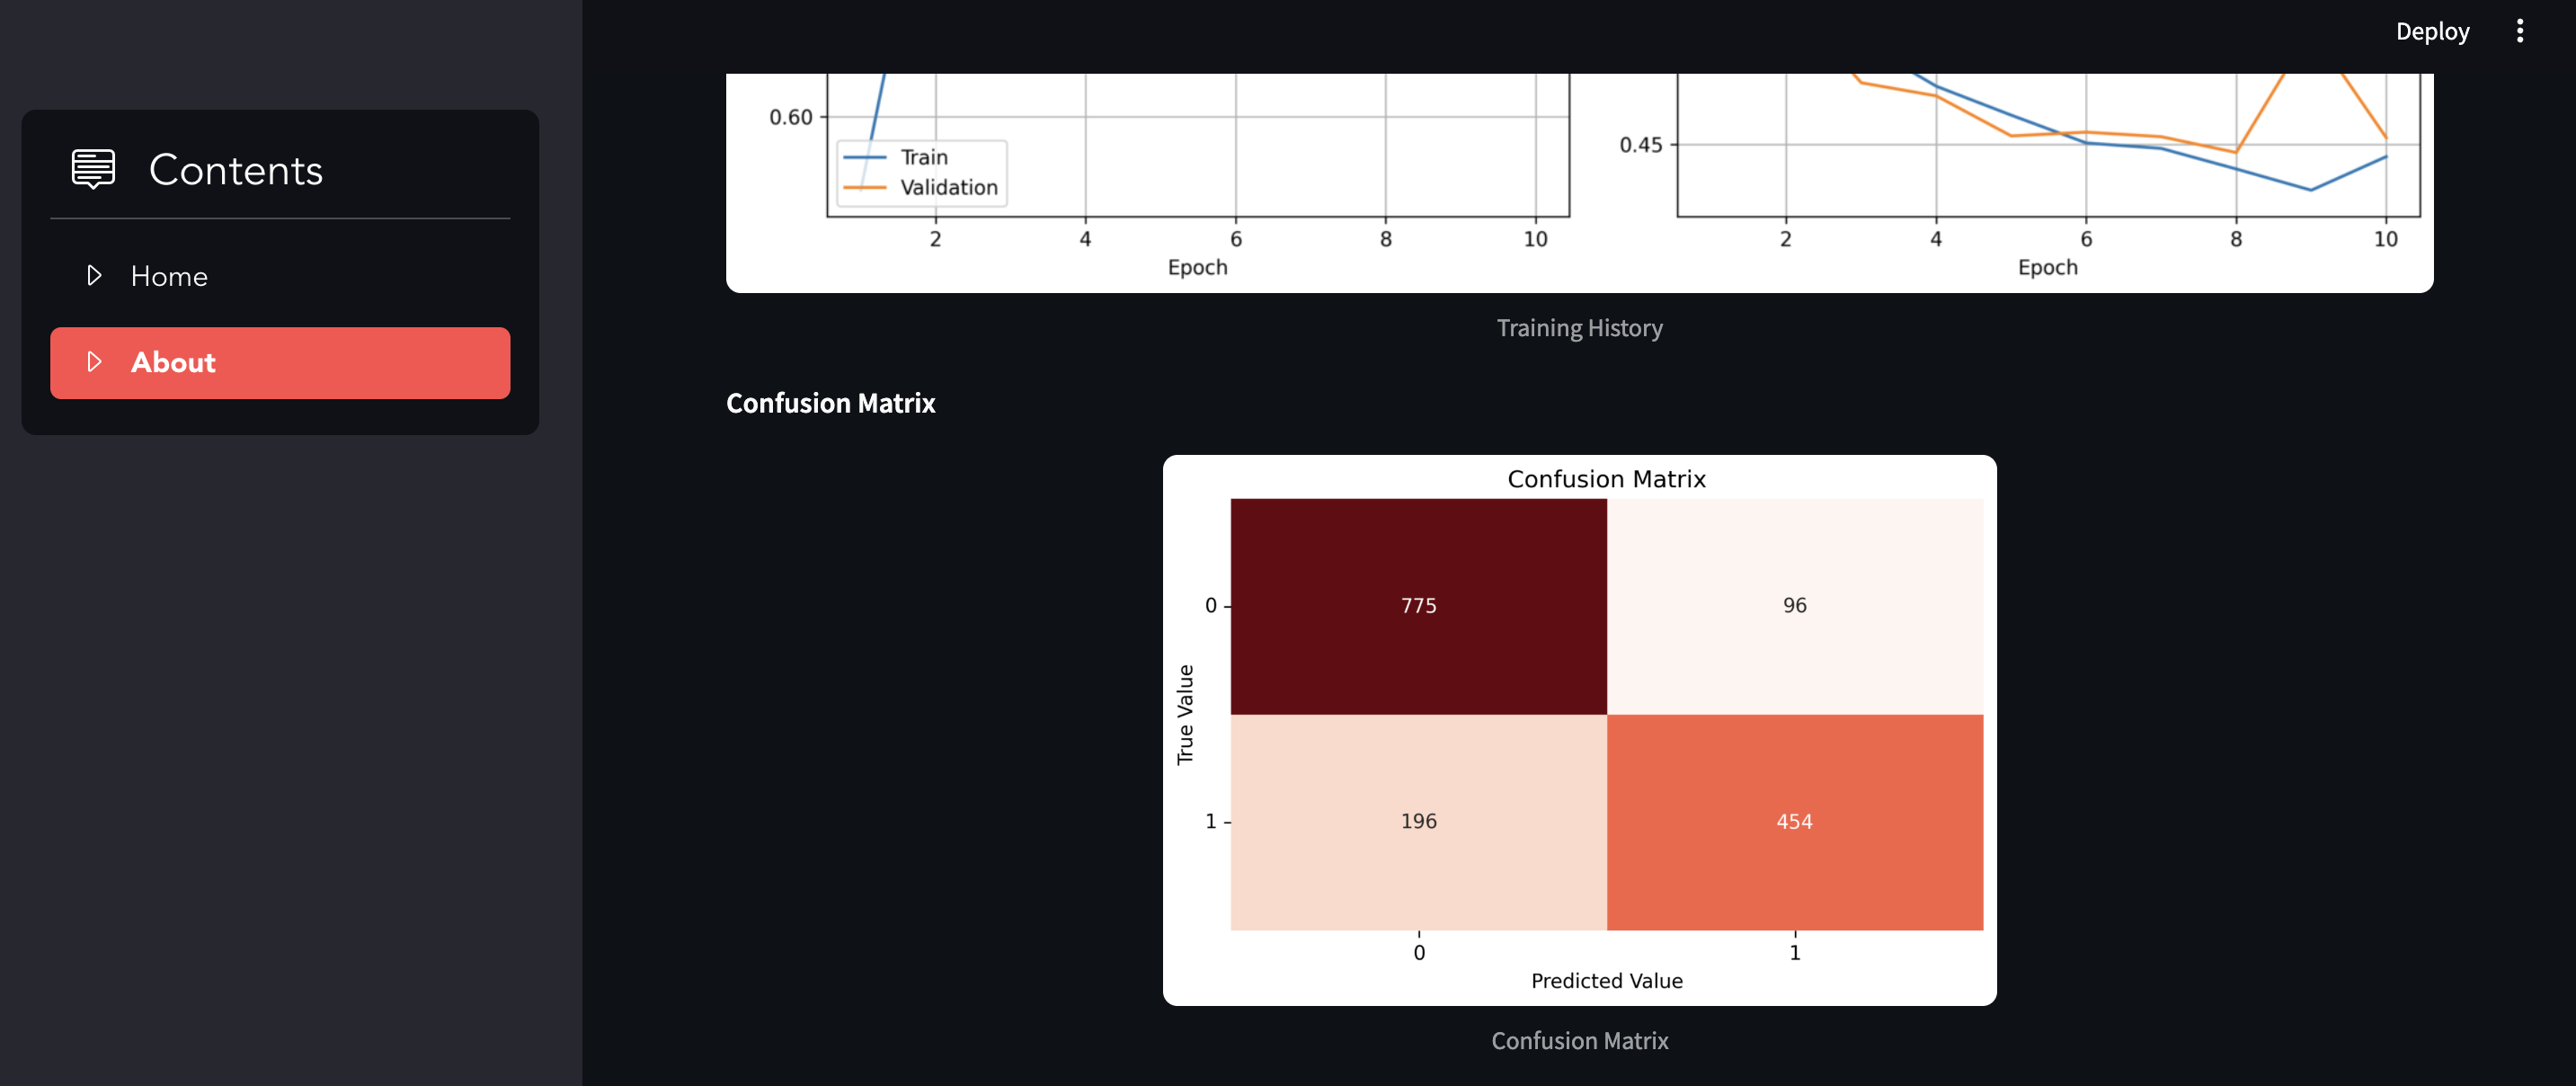
- Performance metrics (Accuracy, Classification report, Confusion matrix)
Workflow
Step 1. Data Setup
- Loads the training dataset from a CSV file using
pandas. - If the GloVe embedding file not exists, download the file from a predefined URL.
Step 2. Data Exploration
- Uses Seaborn’s
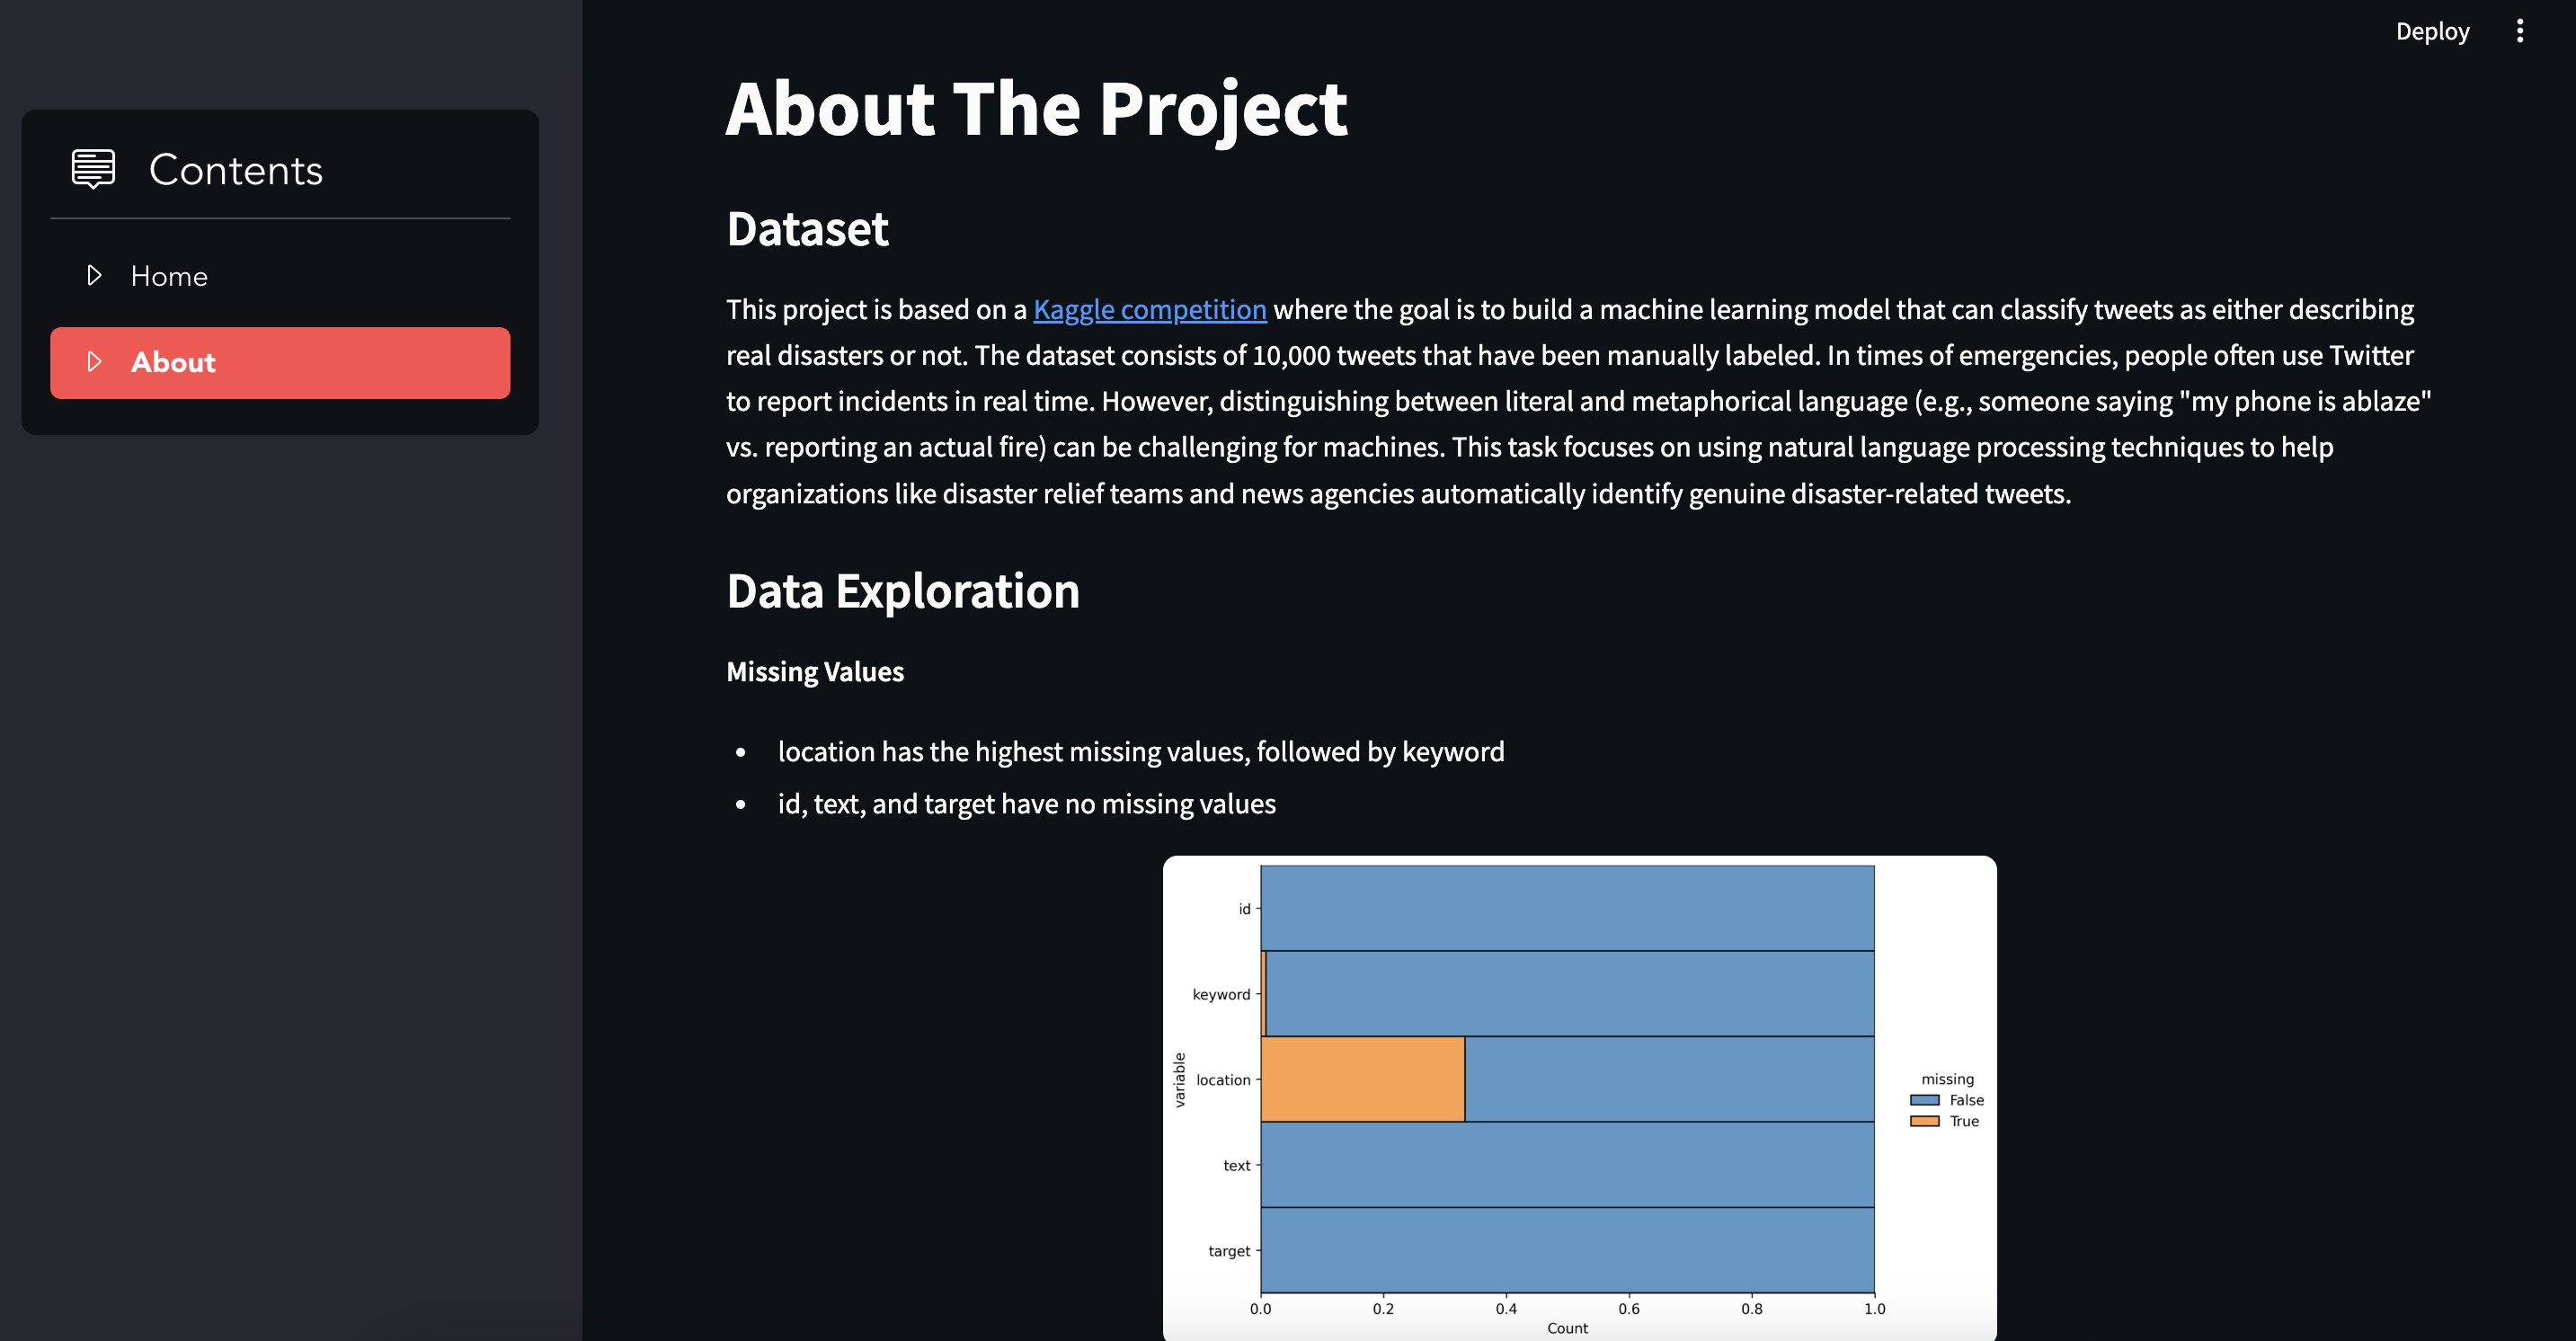
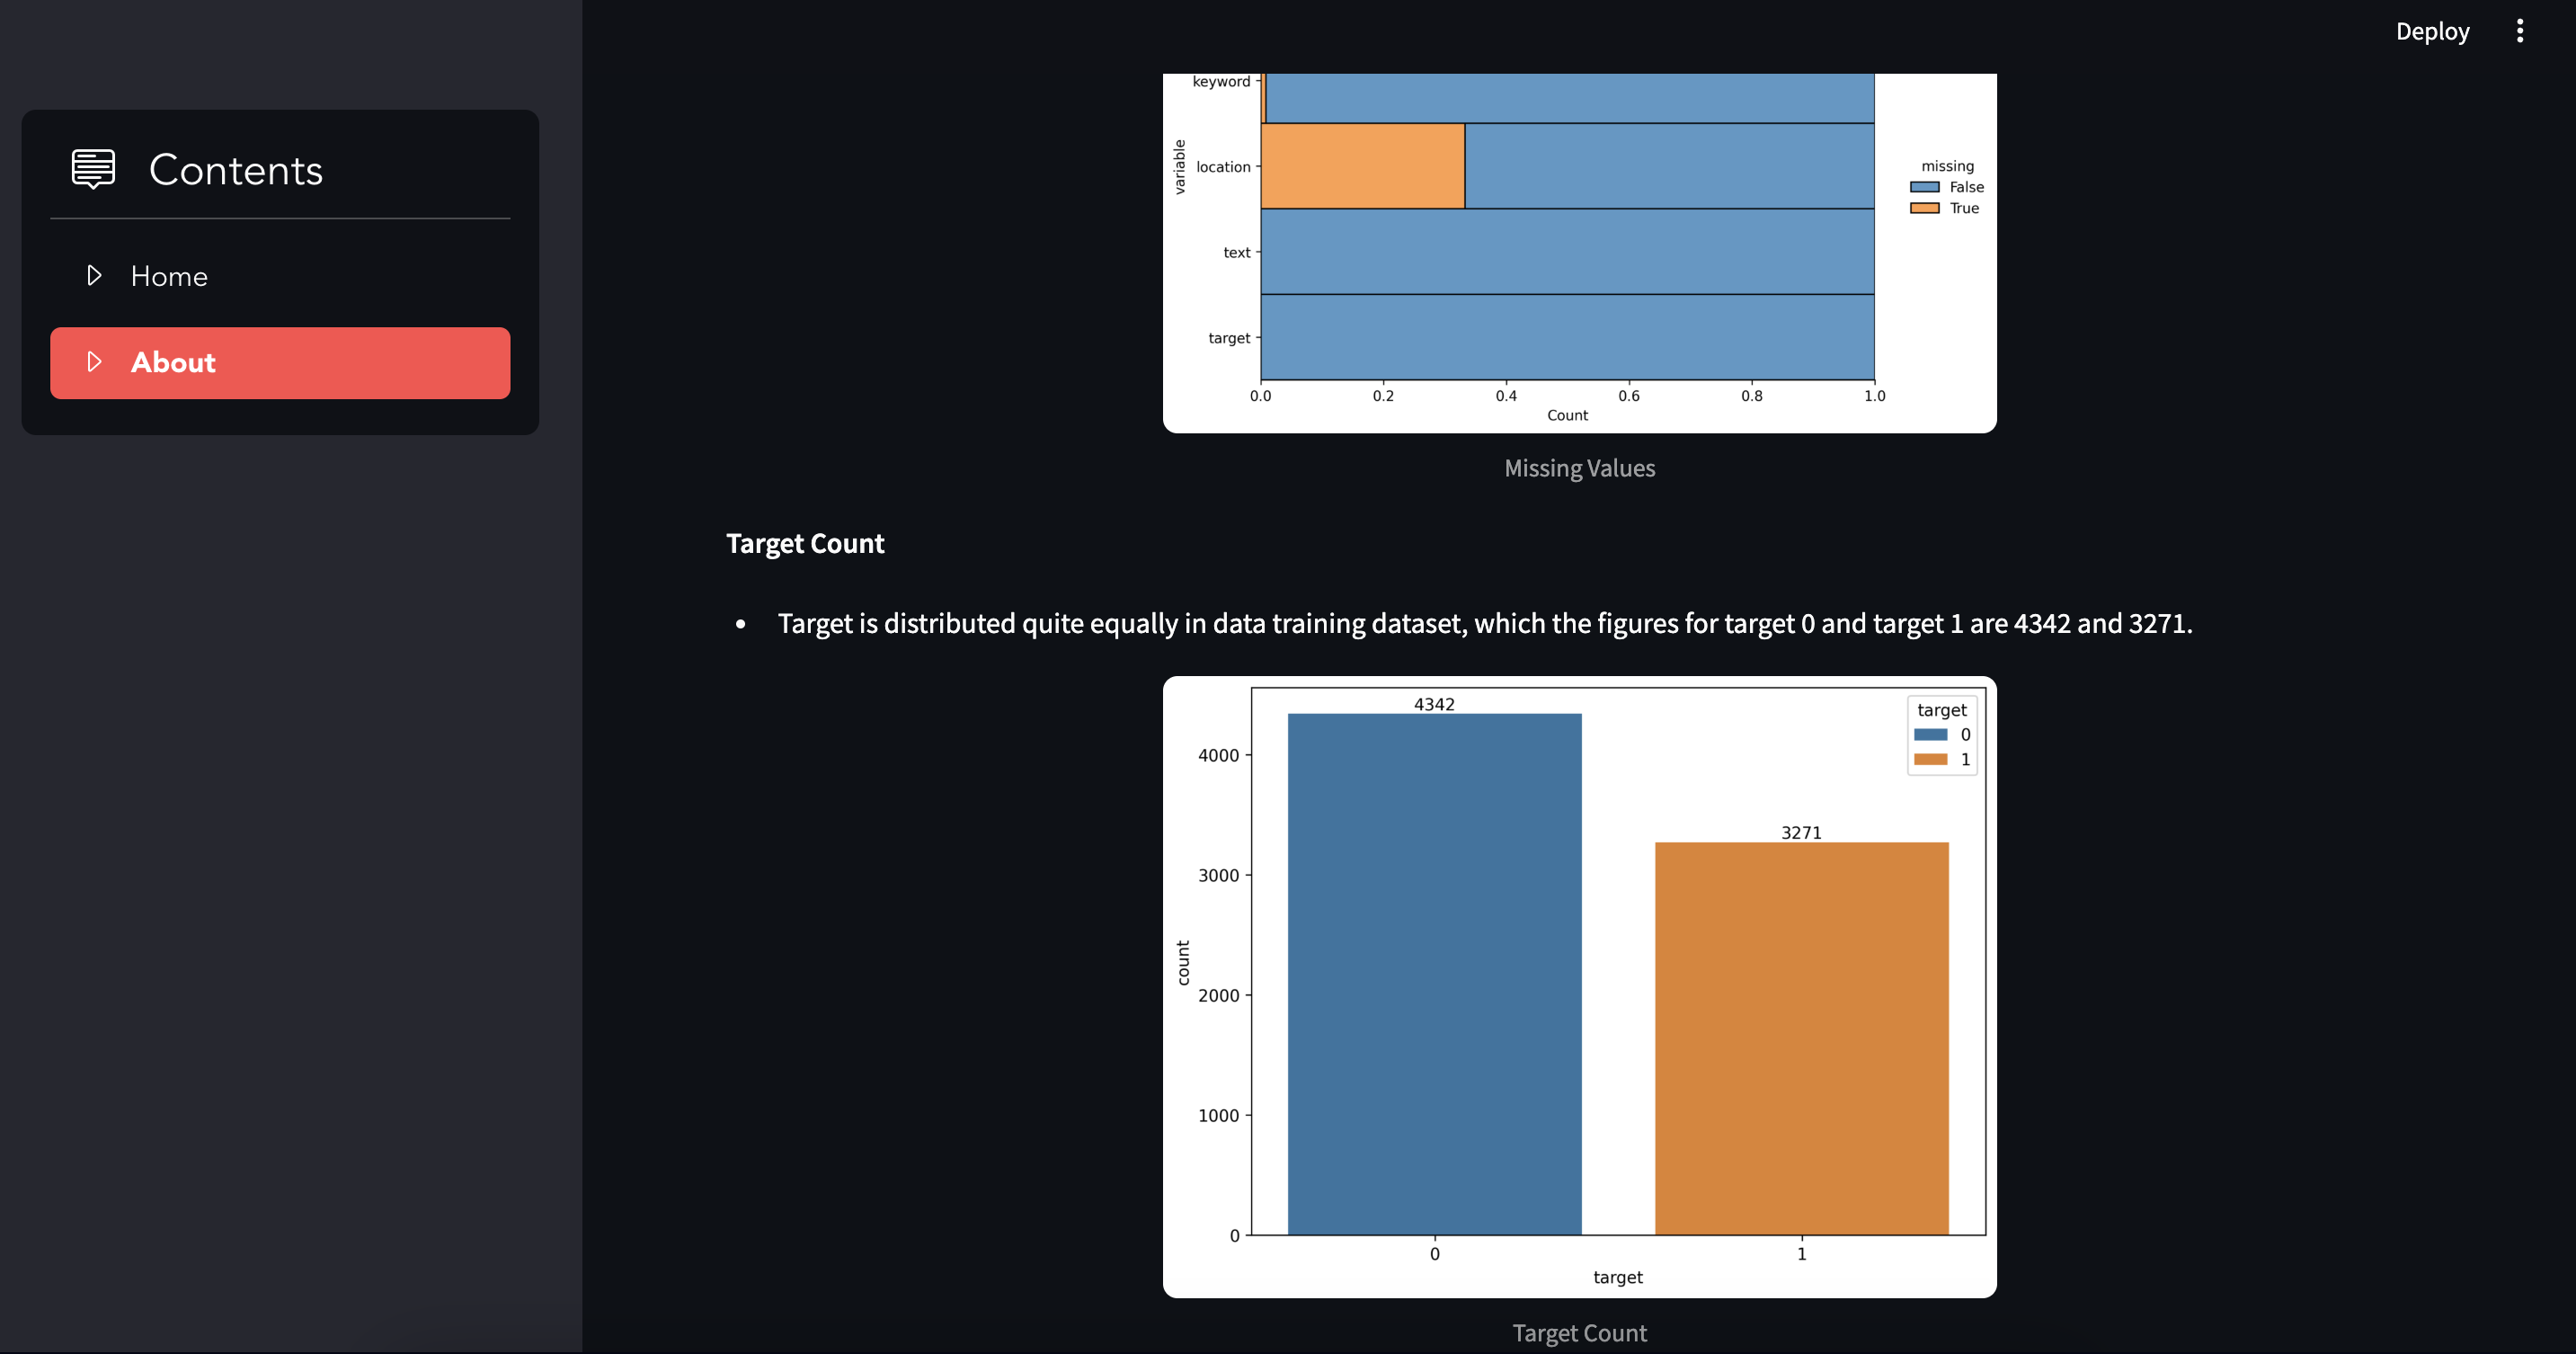
displotto visualize missing values per variable and saves the plot. - Creates a count plot showing the balance of target classes (0 and 1) and saves the visualization.
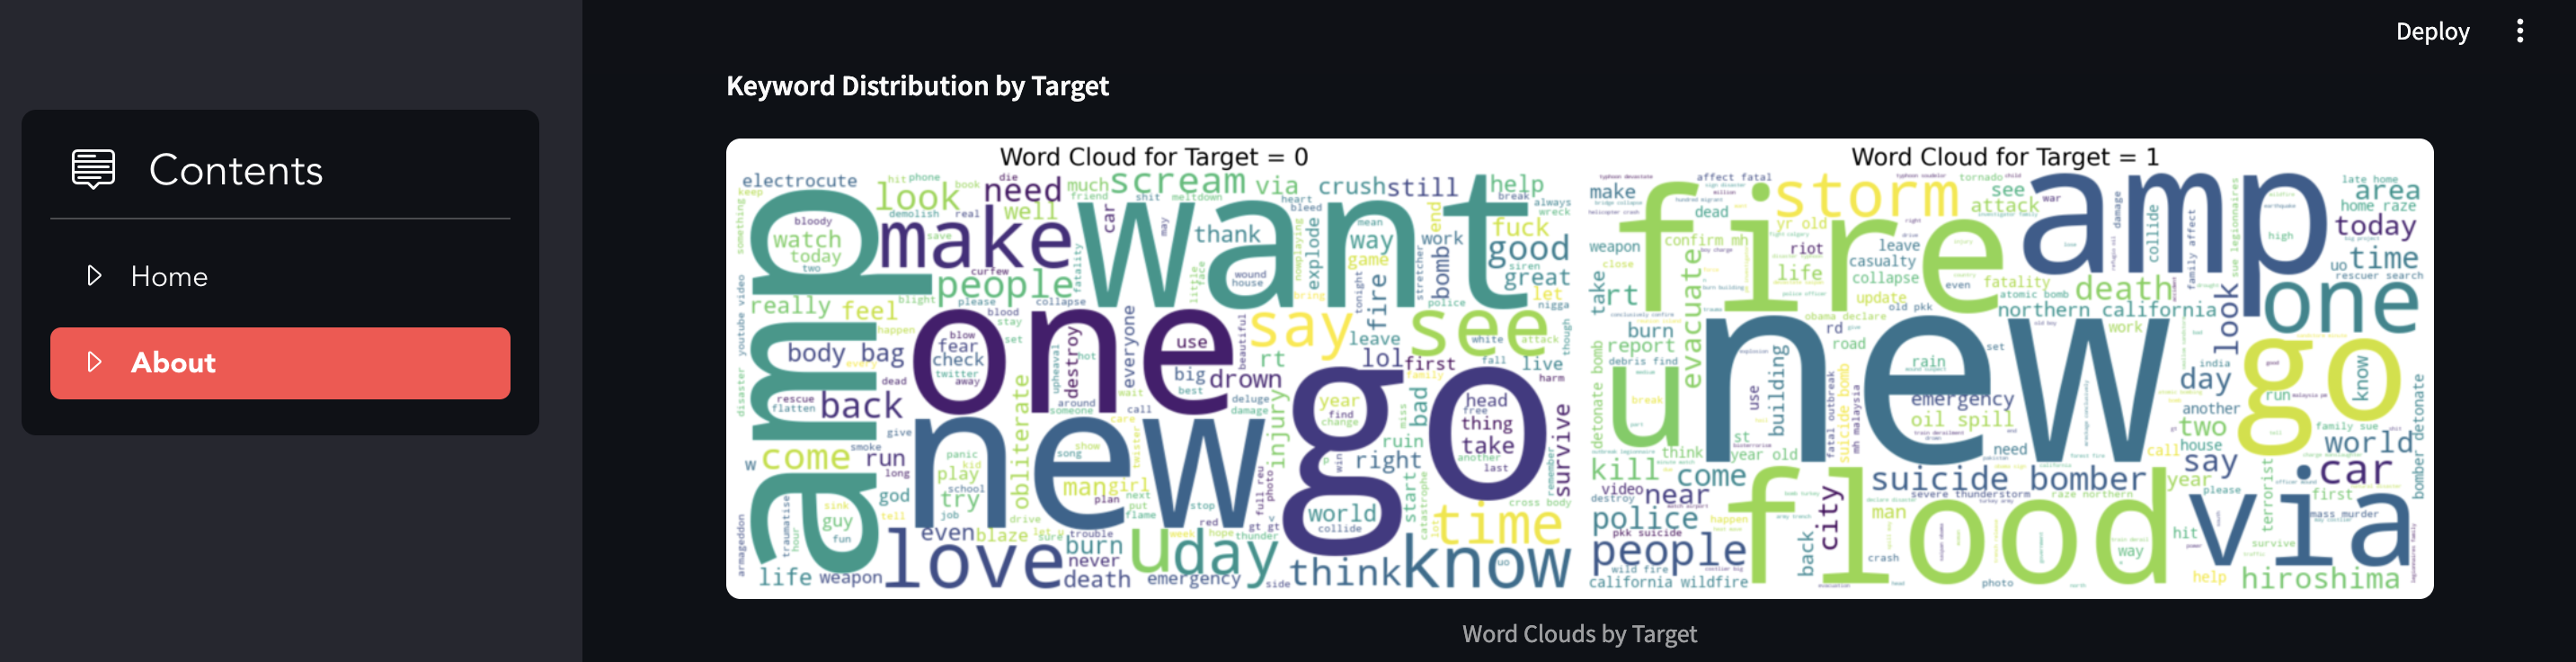
- Generates word clouds for each target class (0 and 1) and saves the figure.
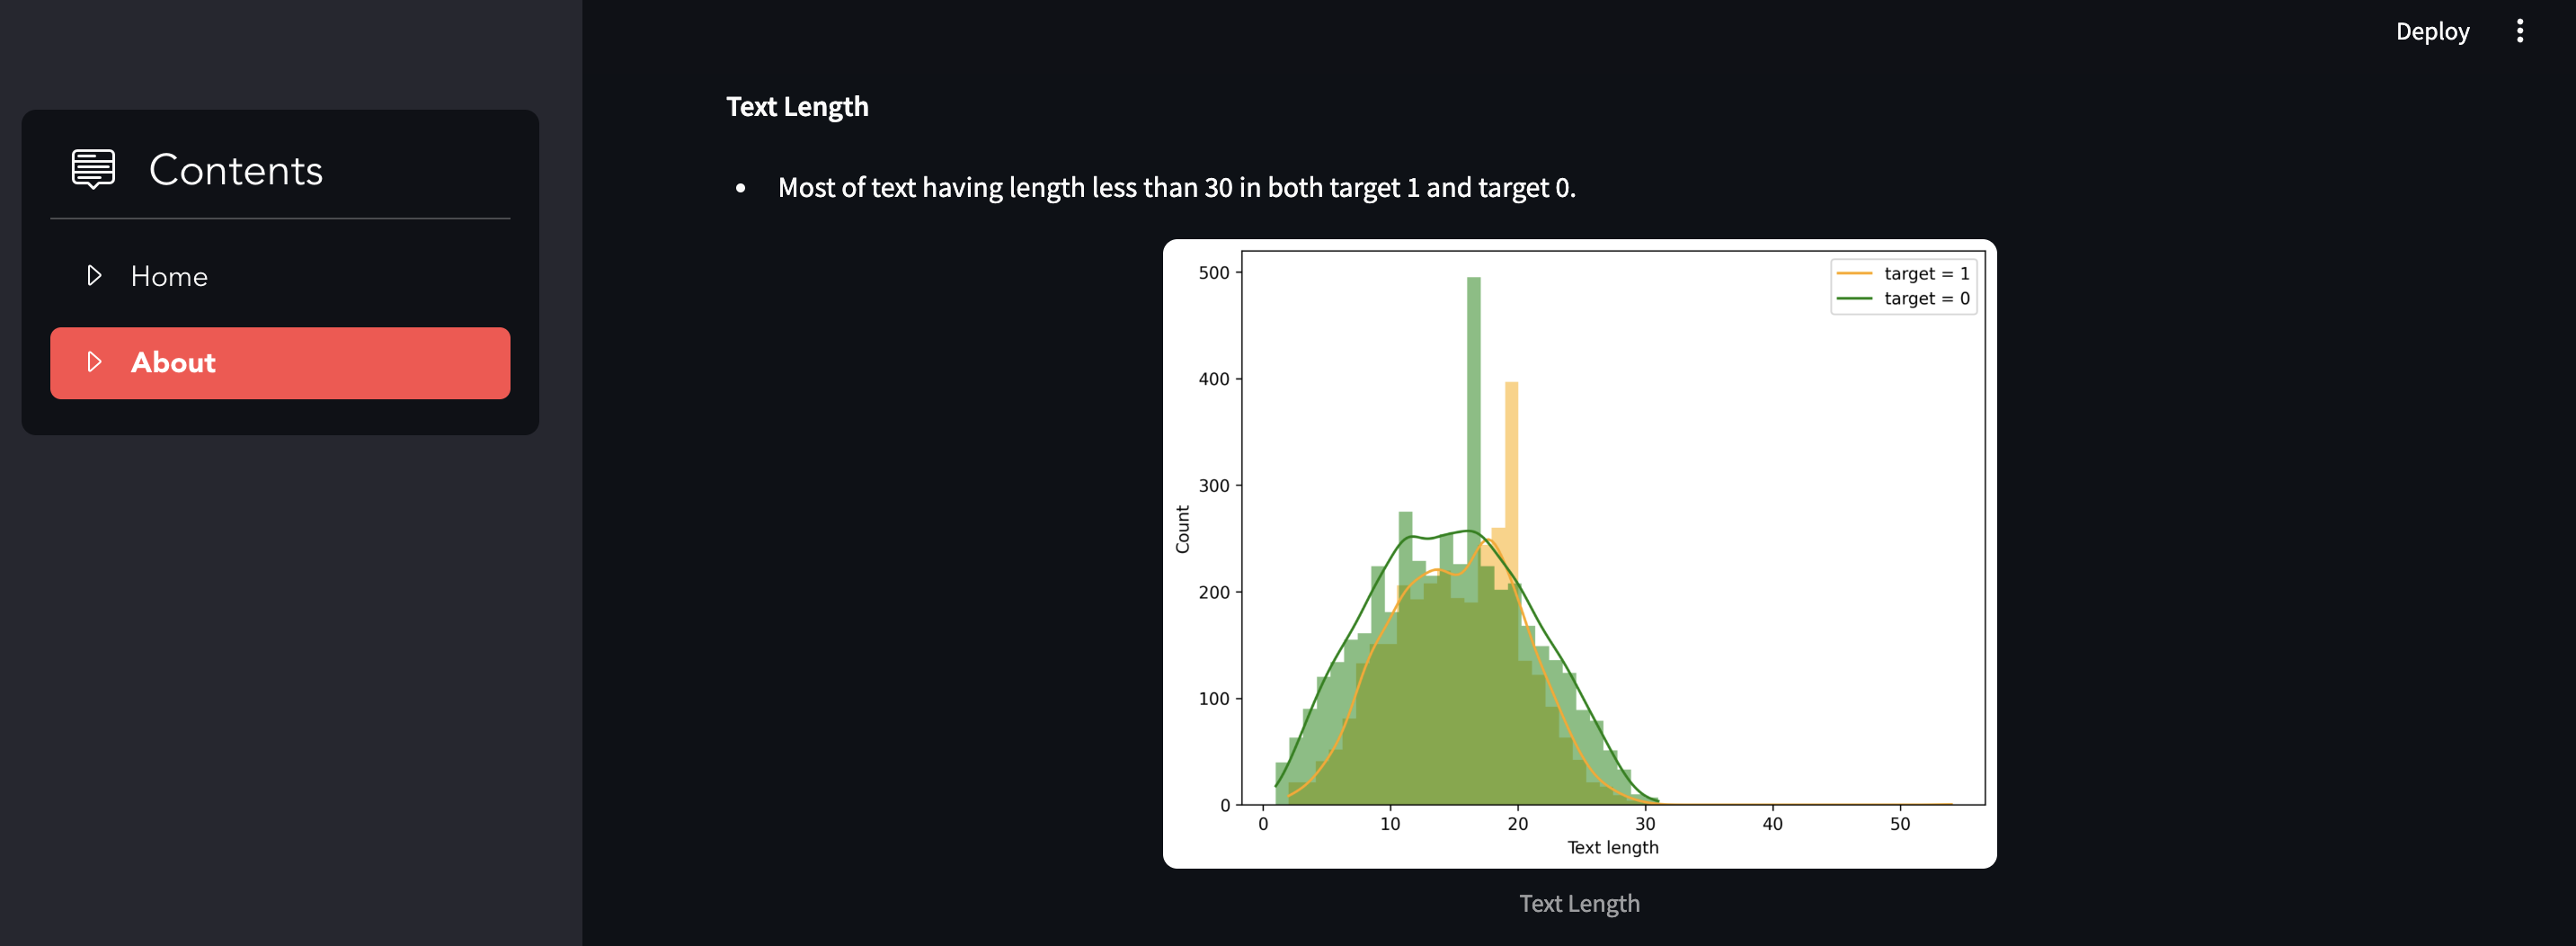
- Calculates text length by word count and visualizes distribution for both target classes.
Step 3. Data Preprocessing
- Applies
clean_text()on all text fields with lowercasing, noise removal, stopword removal, and lemmatization. - Removes records with text length greater than a predefined
MAX_LENGTH.
Step 4. Text Tokenization & Embeddings
- Creates a tokenizer from the cleaned text corpus.
- Converts the text corpus into padded sequences to ensure uniform input length.
- Loads GloVe word vectors and creates an embedding matrix mapping each vocabulary word to its vector.
Step 5. Model Training
- Train test split: Splits the dataset into 80% training and 20% test data.
- Model Architecture:
- Embedding layer (using the pretrained embedding matrix, non-trainable)
- LSTM layer with dropout and recurrent dropout
- Dense output layer with sigmoid activation for binary classification.
- Training Setup:
- Compiles the model with Adam optimizer and binary cross-entropy loss.
- Uses
ModelCheckpointto save the best model based on validation accuracy. - Trains the model with a batch size of 1000 over
EPOCH_NUMepochs.
Step 6. Model Evaluation
- Loads the best saved model.
- Predicts on the test data and converts probabilities to binary predictions.
- Evaluates and prints the model’s accuracy and classification report.
- Plots and saves the confusion matrix.
Functionalities
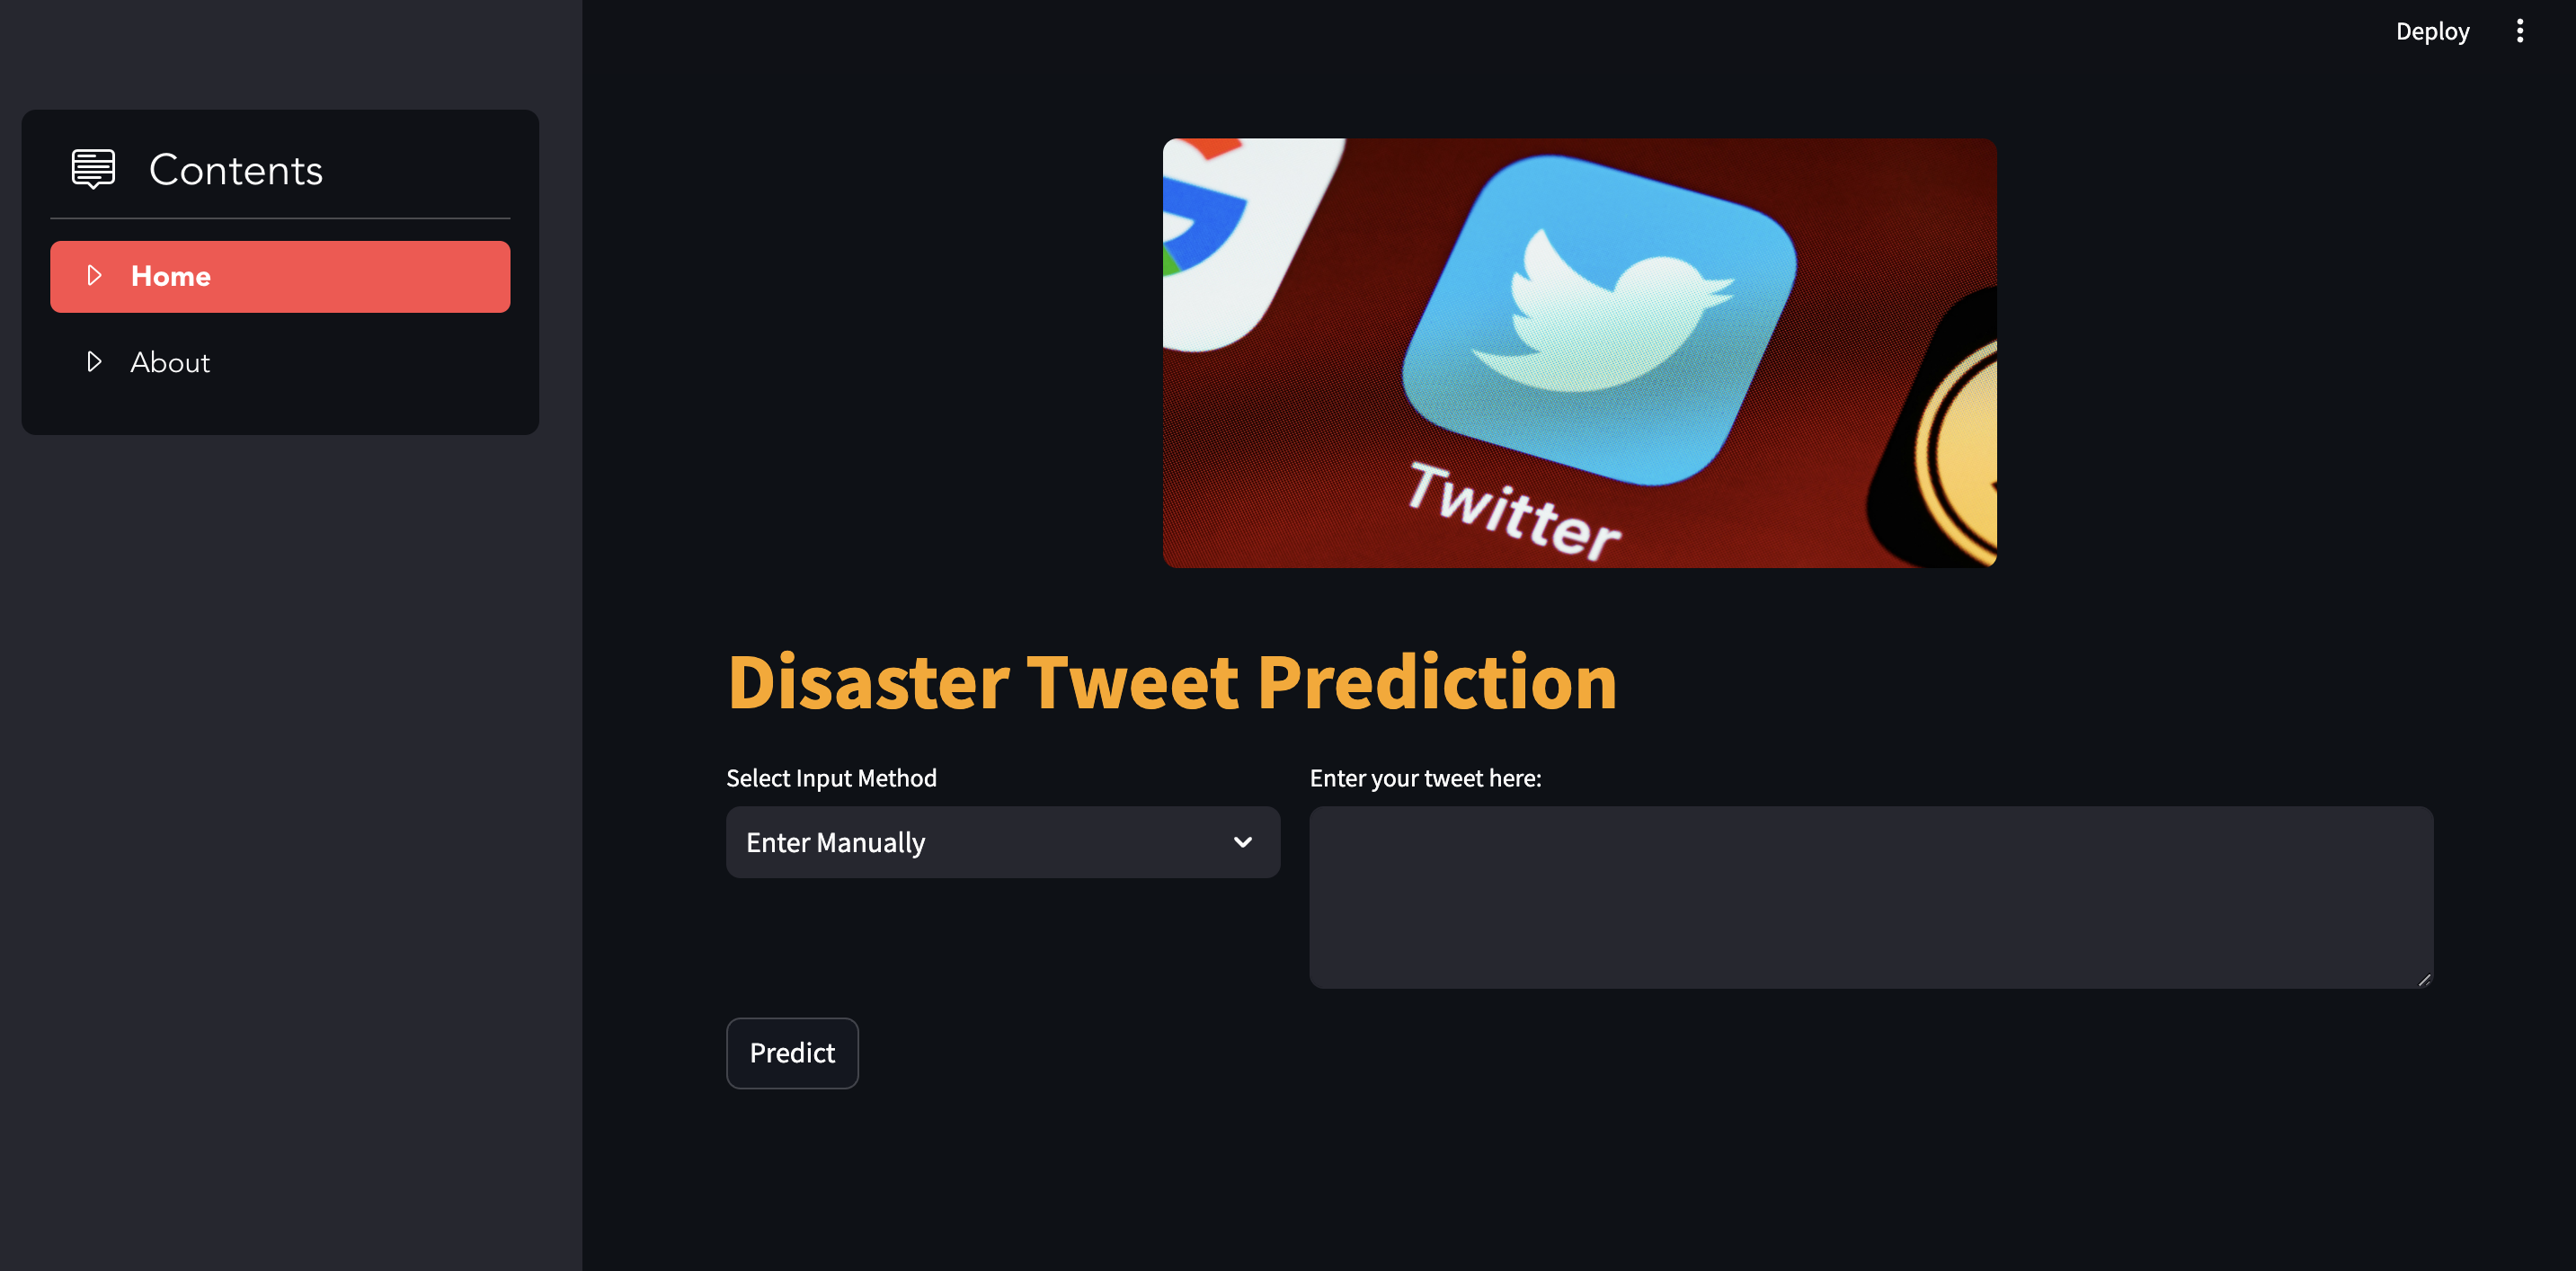
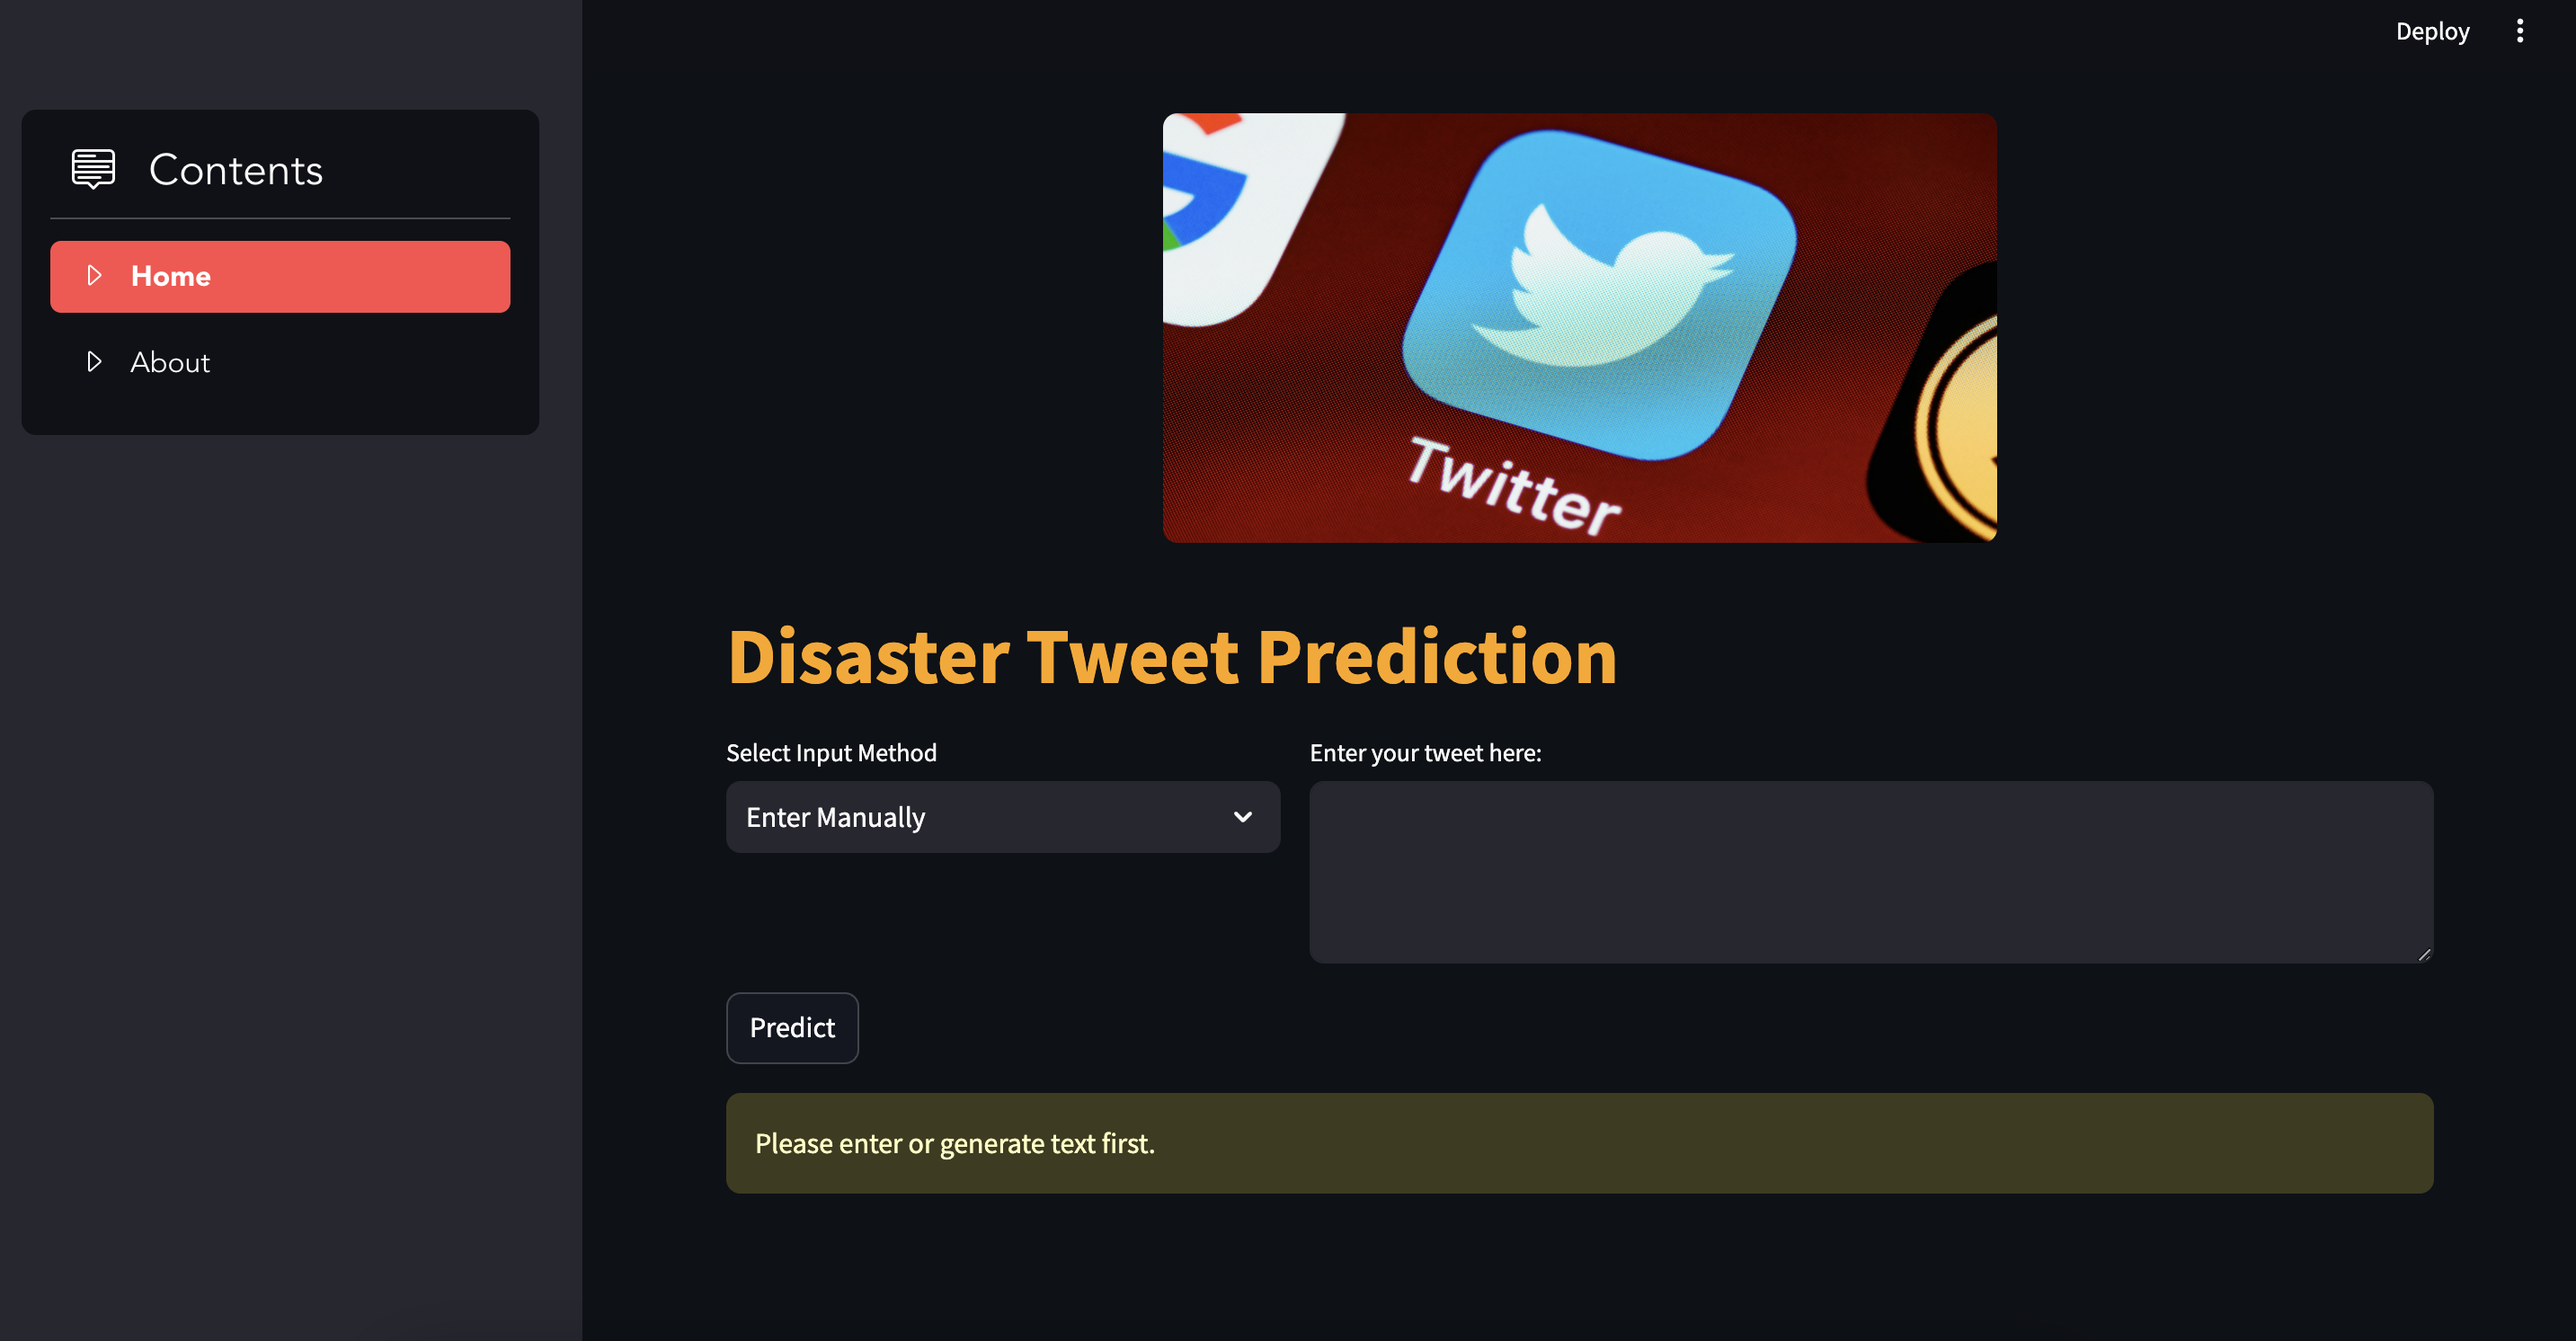
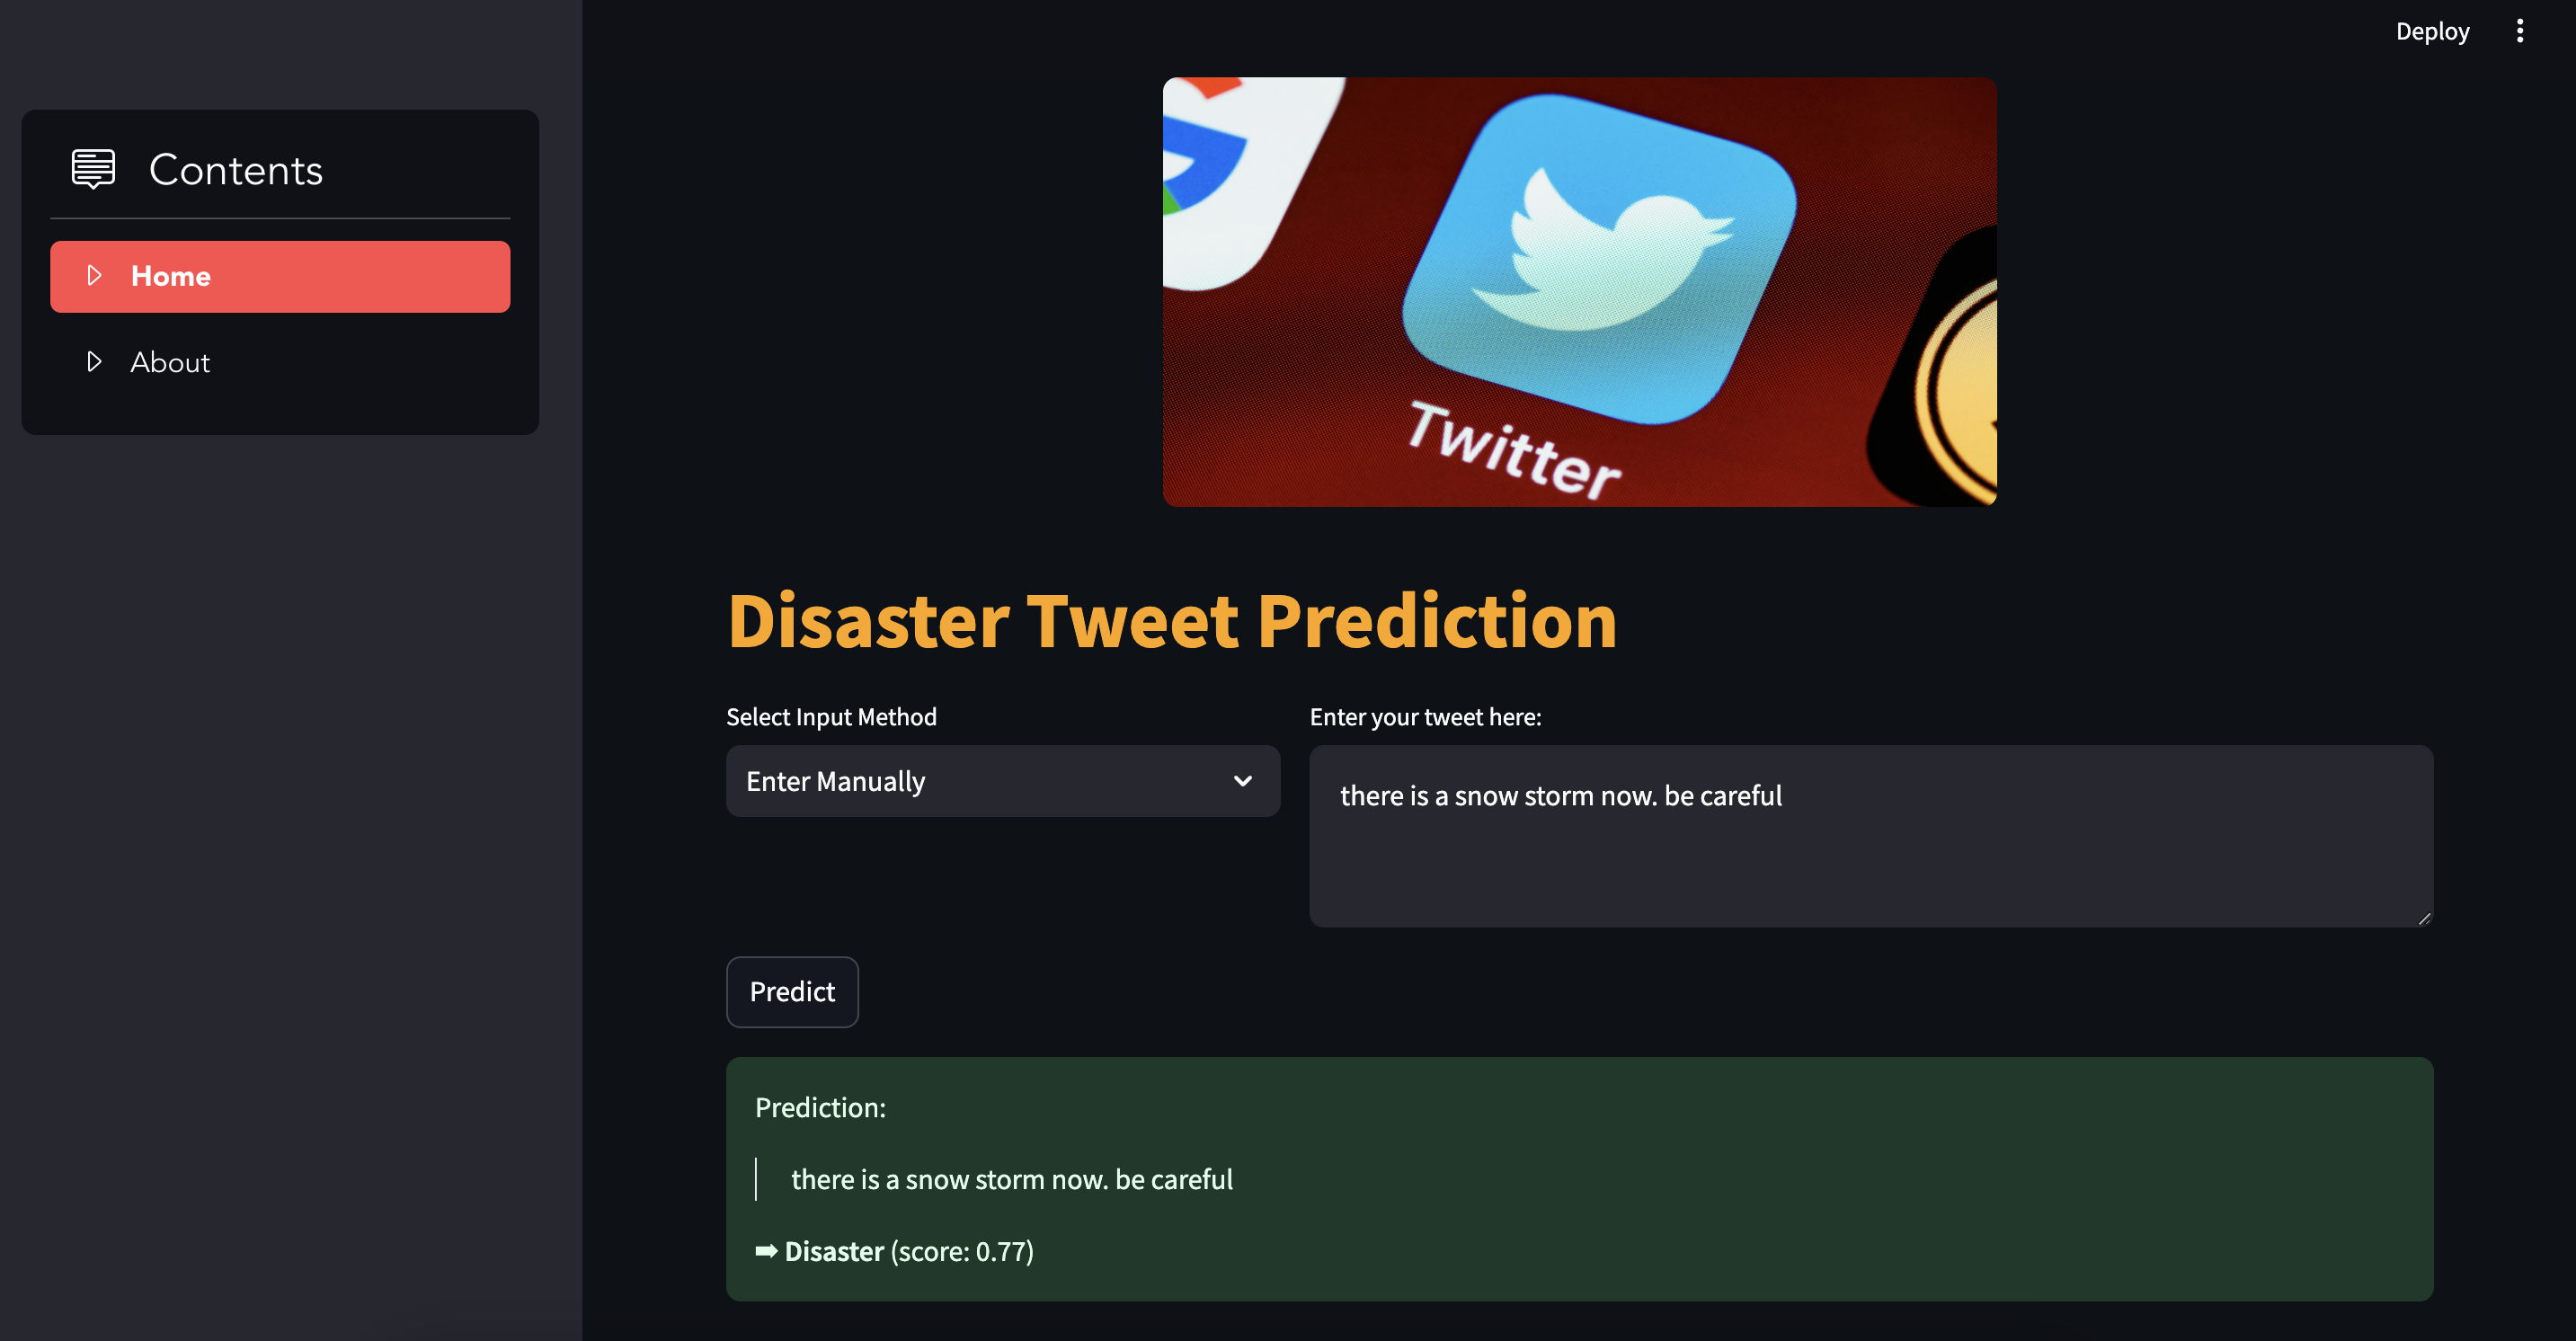
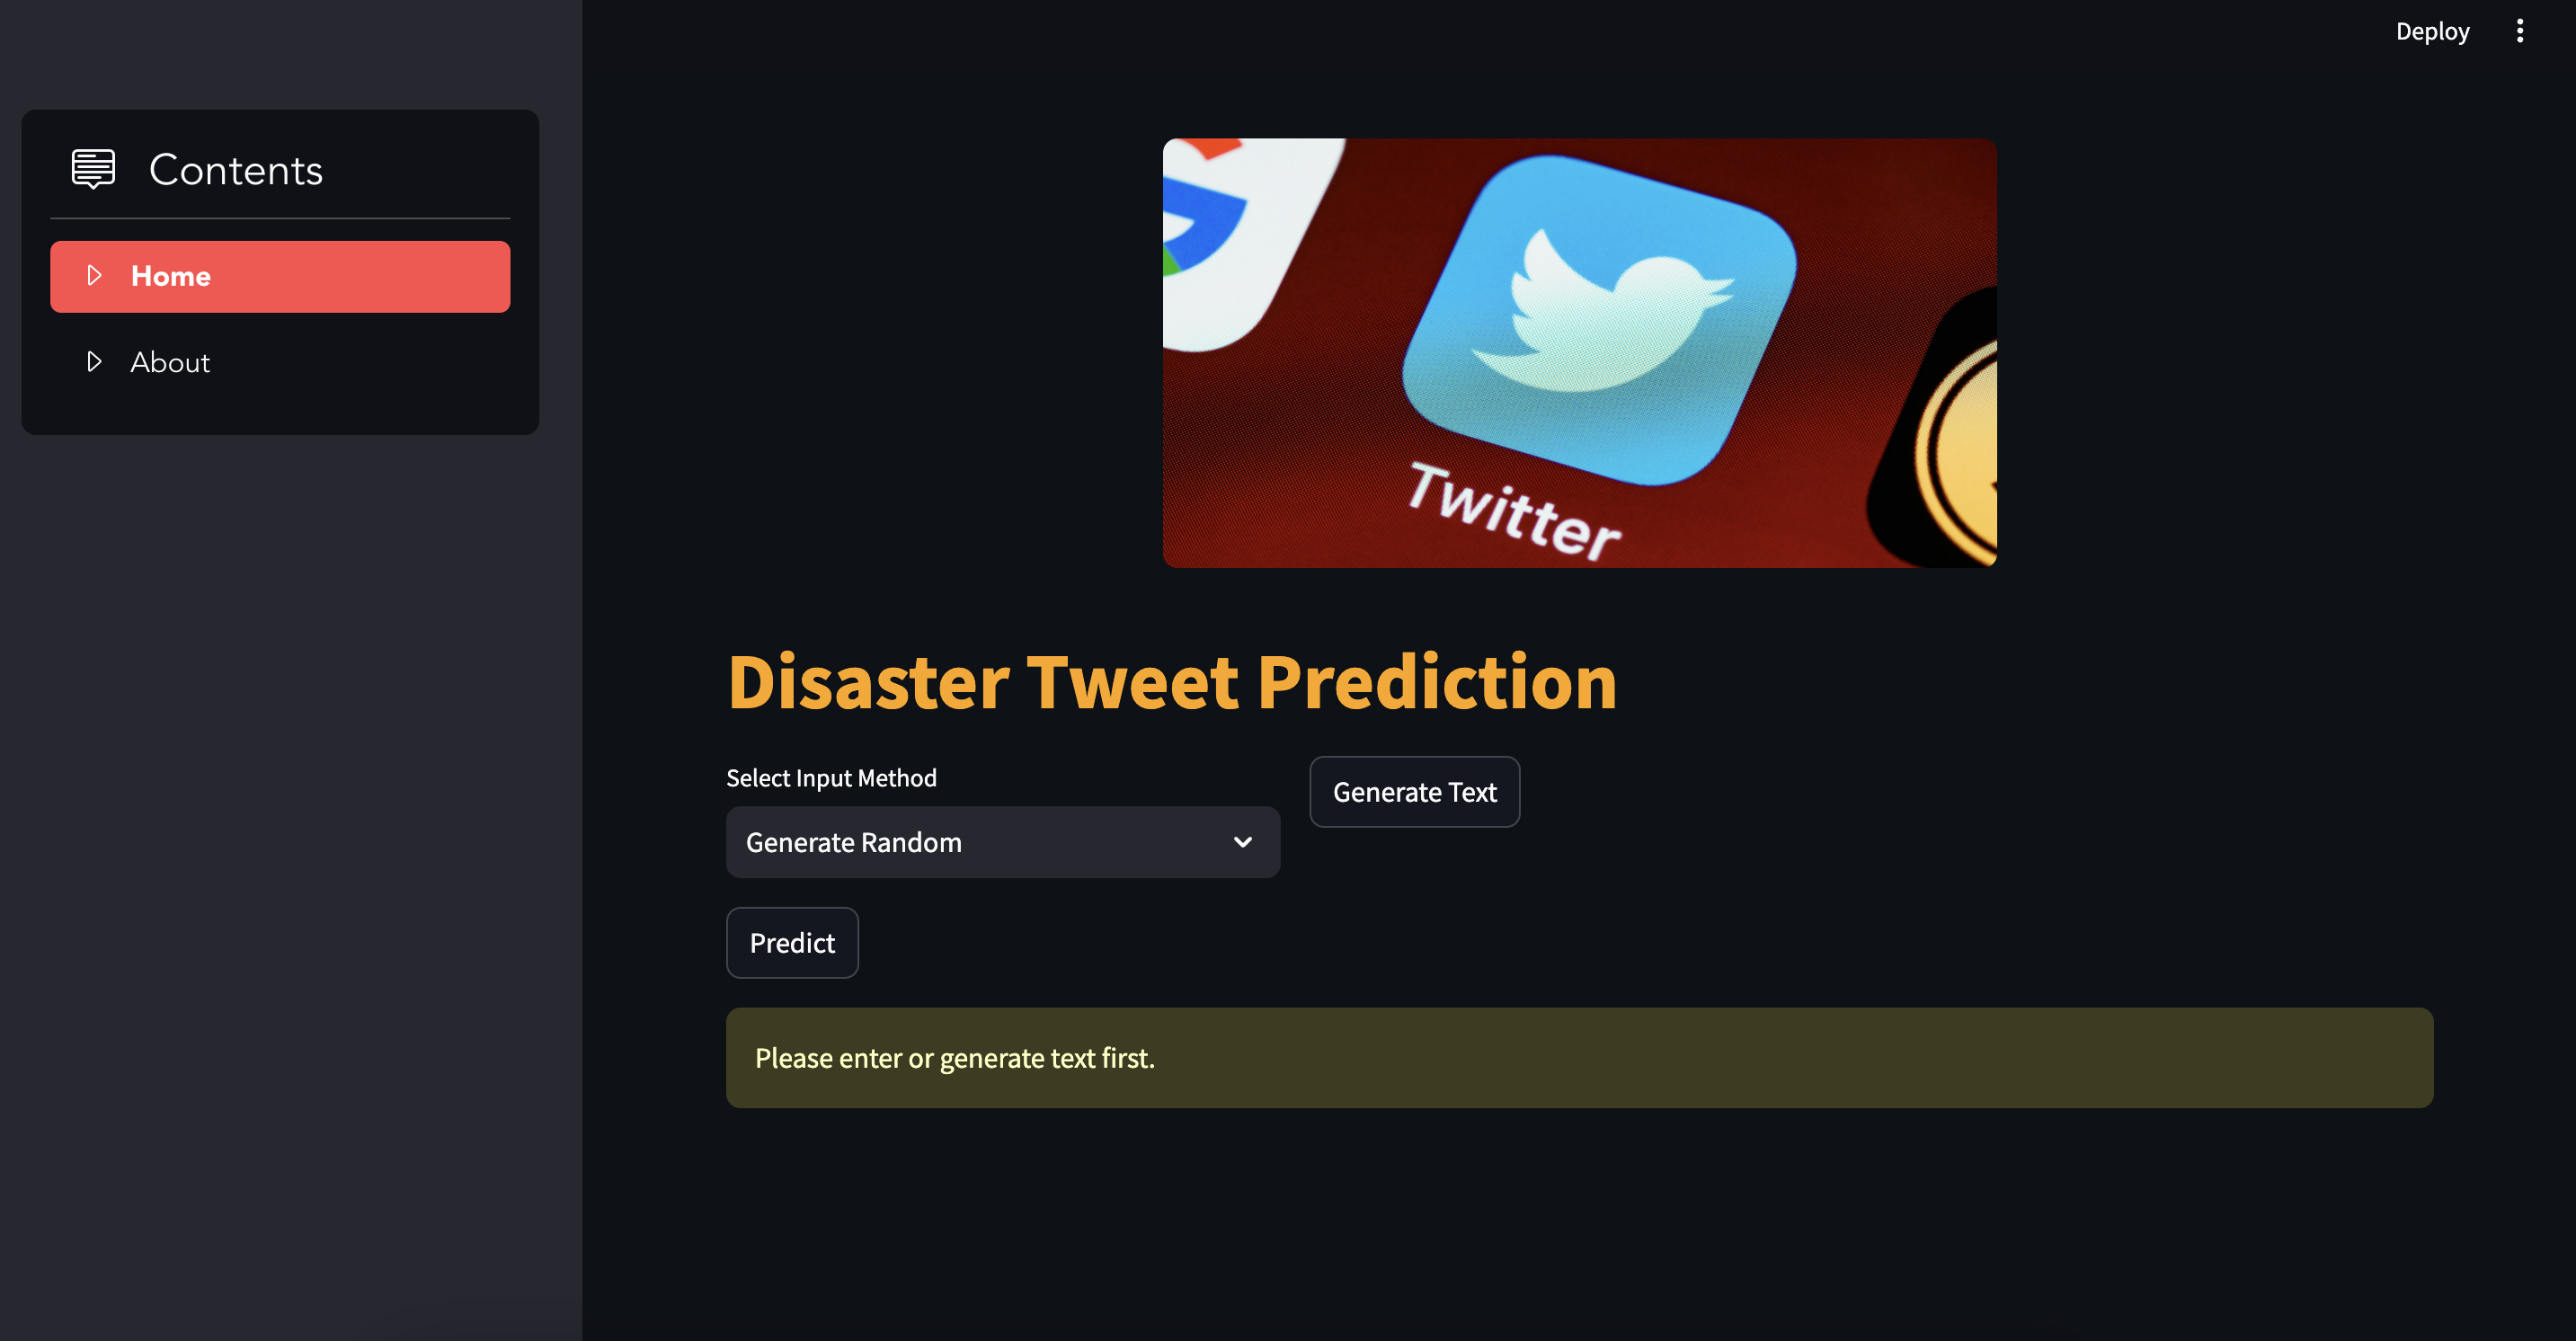
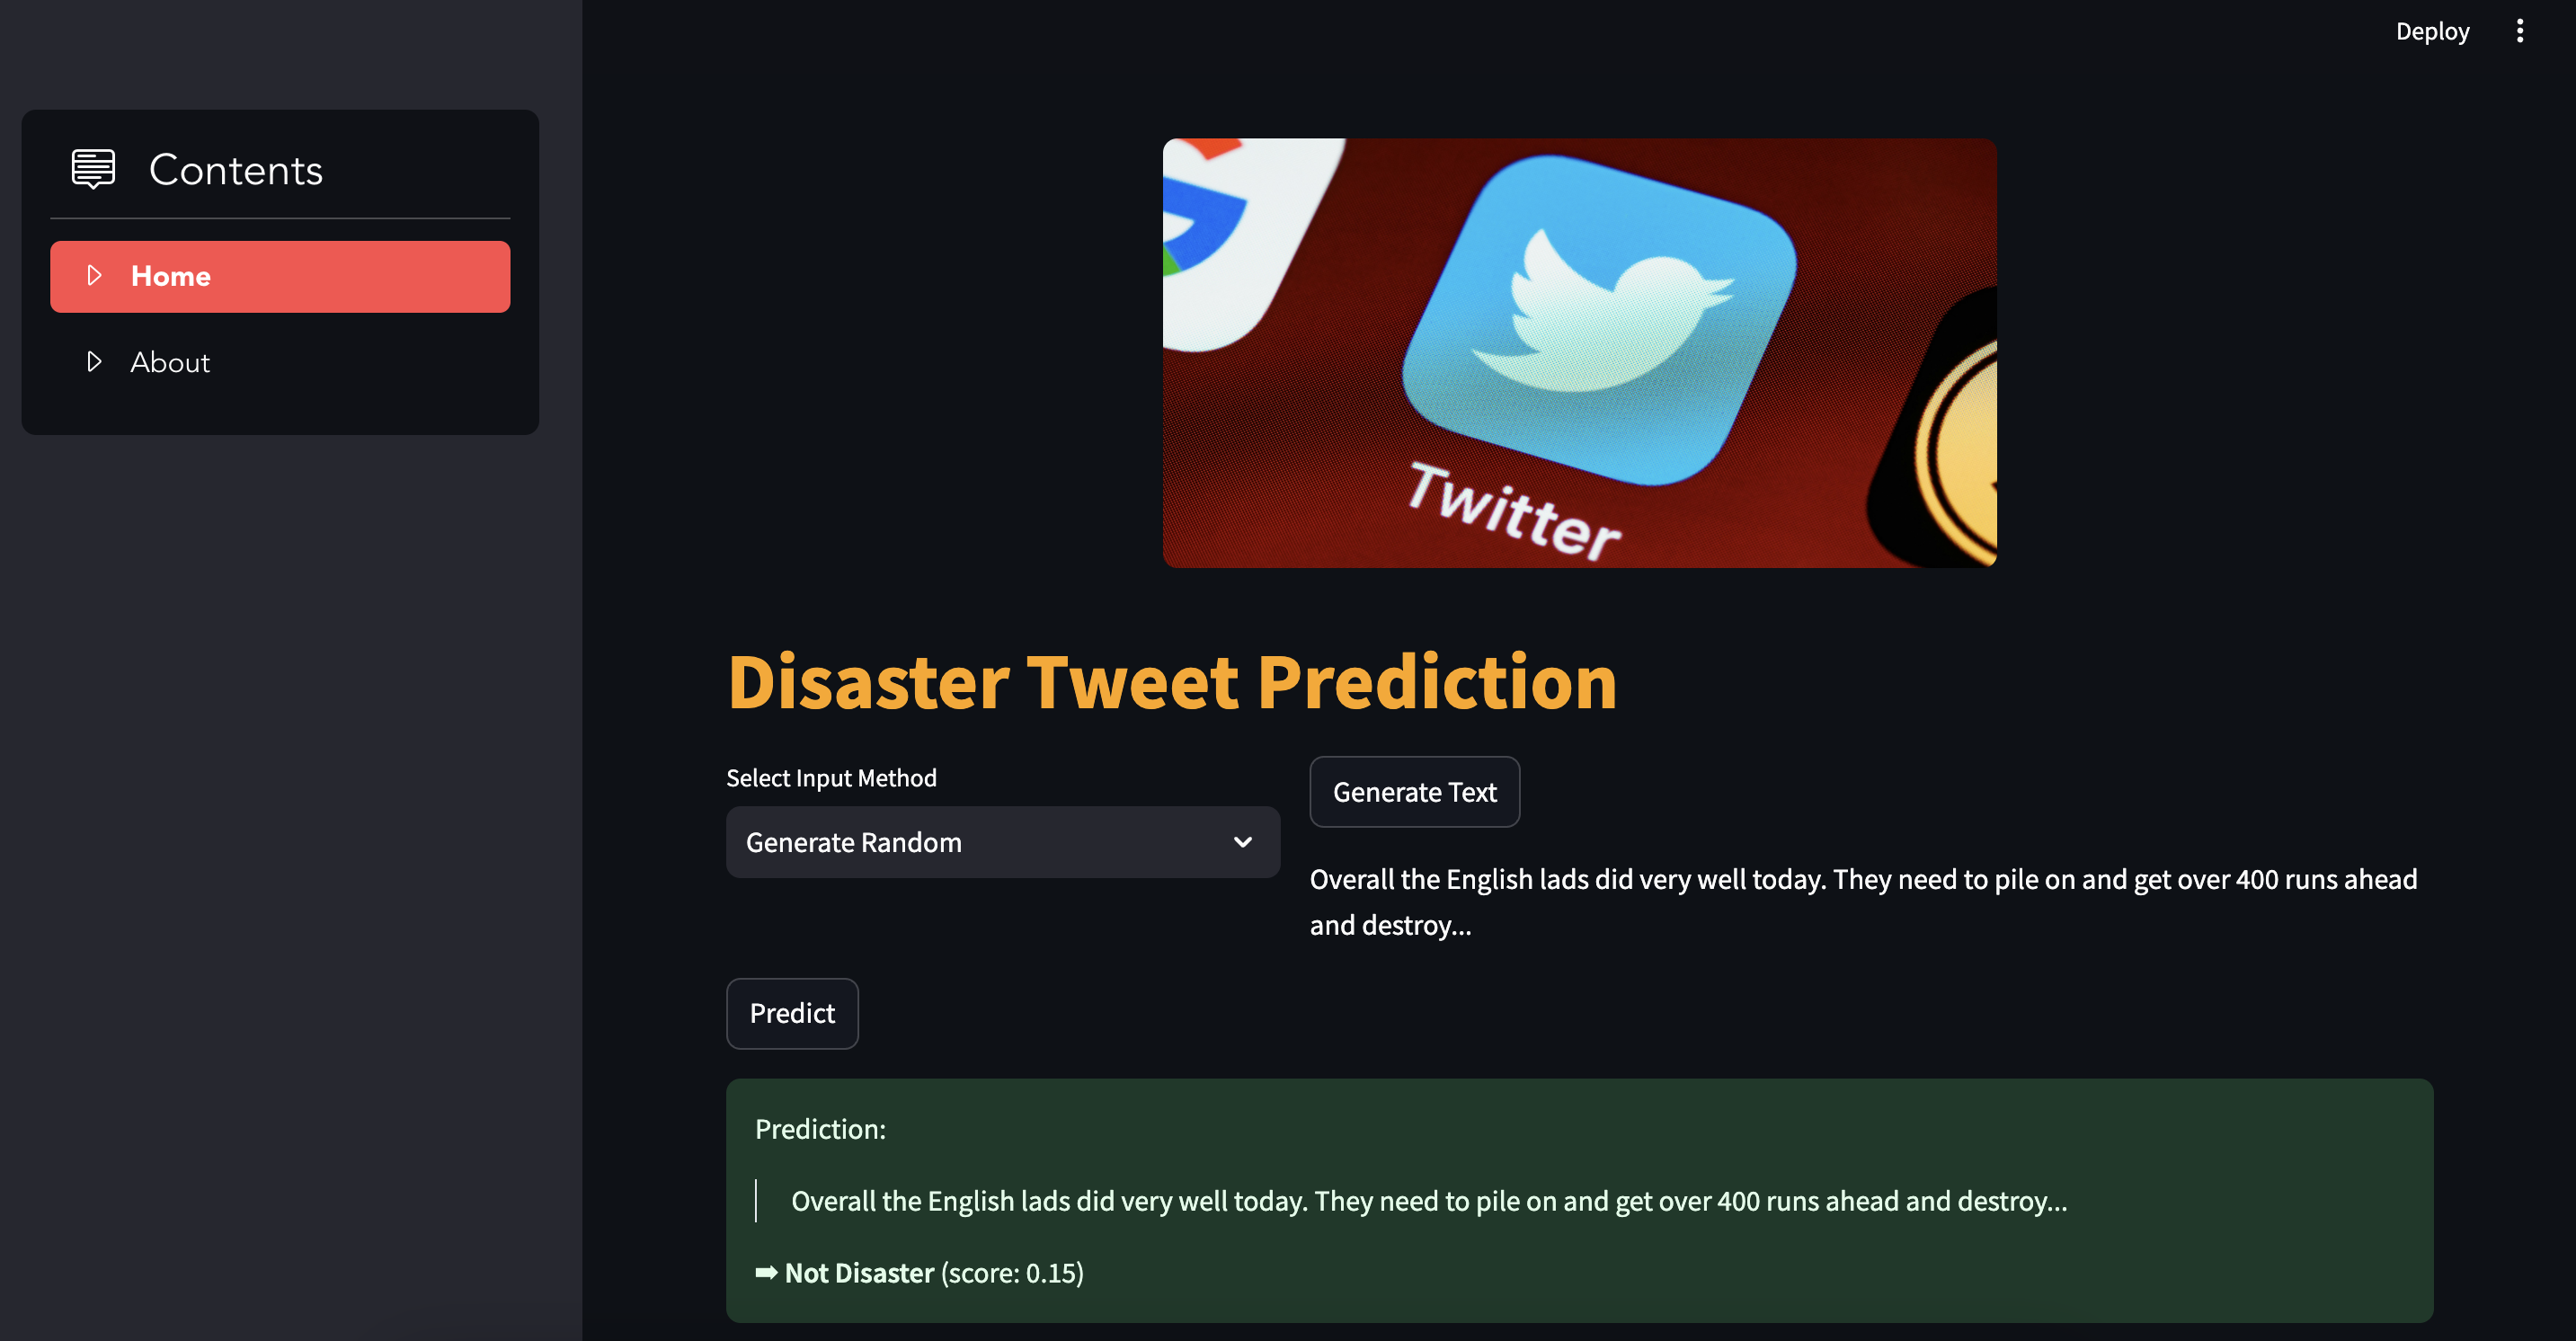
- Predict whether text input is a warning for disaster: Text input for user input or random tweet. Predict button showing prediction class with score.
- About page: introduce dataset description, show data visualization, and display training history and confusion matrix