Building a time series model to forecast COVID-19 new cases
Business Scenario
This app provides an interactive, visual, and quantitative COVID-19 forecasting tool using advanced time series and machine learning techniques. The training dataset originates from COVID-19 data curated by Our World in Data (OWID), based on reports from the Johns Hopkins University Center for Systems Science and Engineering (JHU CSSE). It offers daily time series information on confirmed cases and deaths across various countries and regions. Note that JHU CSSE stopped updating this dataset as of March 10, 2023. The aim of this app is to anticipate case surges and supports data-driven decision-making.
Techniques
- Time Series Forecasting:
- SARIMA Model: Captures seasonality and trends in COVID-19 case data.
- LightGBM Regressor: Models residuals from SARIMA to capture fine-grained, non-linear patterns.
- Data Smoothing: 30-day rolling mean to reduce noise in daily case counts.
- Model Evaluation: MAE, RMSE, and MAPE metrics.
Workflow
Step 1: Data Loading
- Fetches global COVID-19 data from an online CSV.
- Filters by user-selected country.
Step 2: Preprocessing
- Converts dates, sets index, and smooths new cases.
Step 3: Modelling
- Splits data into training and test sets based on forecast horizon.
- Fits SARIMA on training data.
- Computes residuals and creates lag features.
- Trains LightGBM on residuals.
- Combines SARIMA and LightGBM predictions for final forecast.
Step 4: Evaluation
- Calculates and displays error metrics.
Step 5: Visualization
- Plots actual vs. predicted cases for the forecast period.
Functionalities
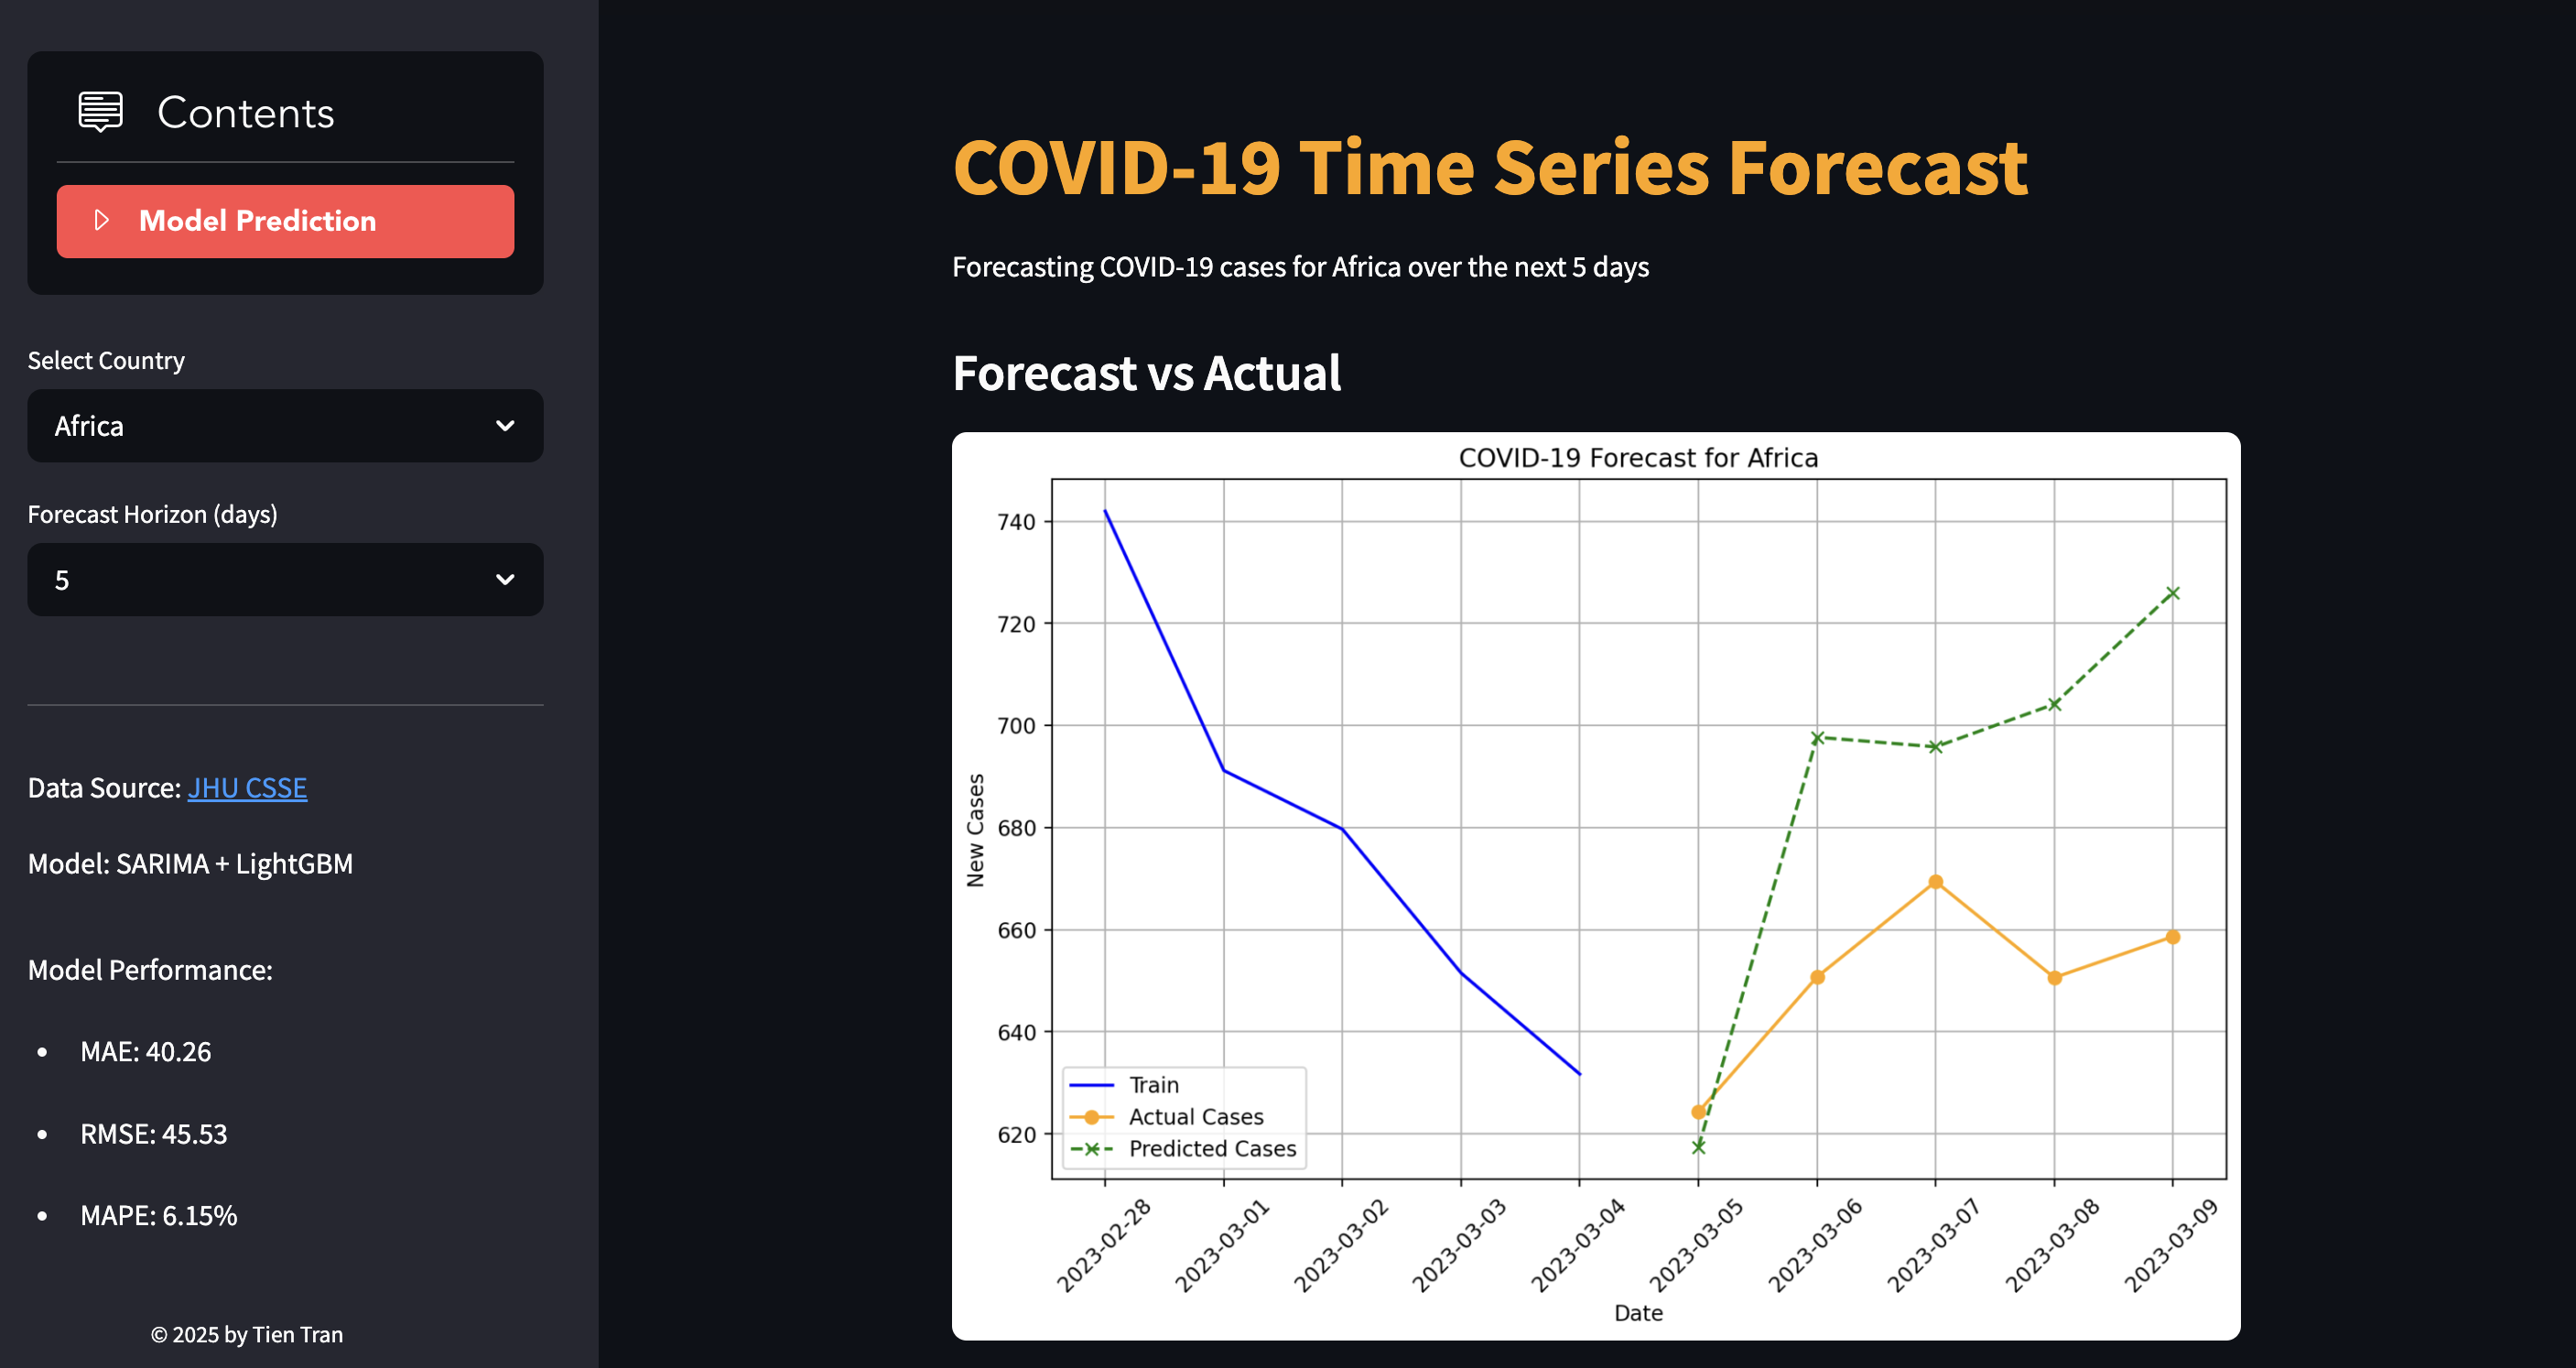
Interactive plot of forecast vs. actual cases on main page (default Country = United States and Forecast Horizon = 30 days)
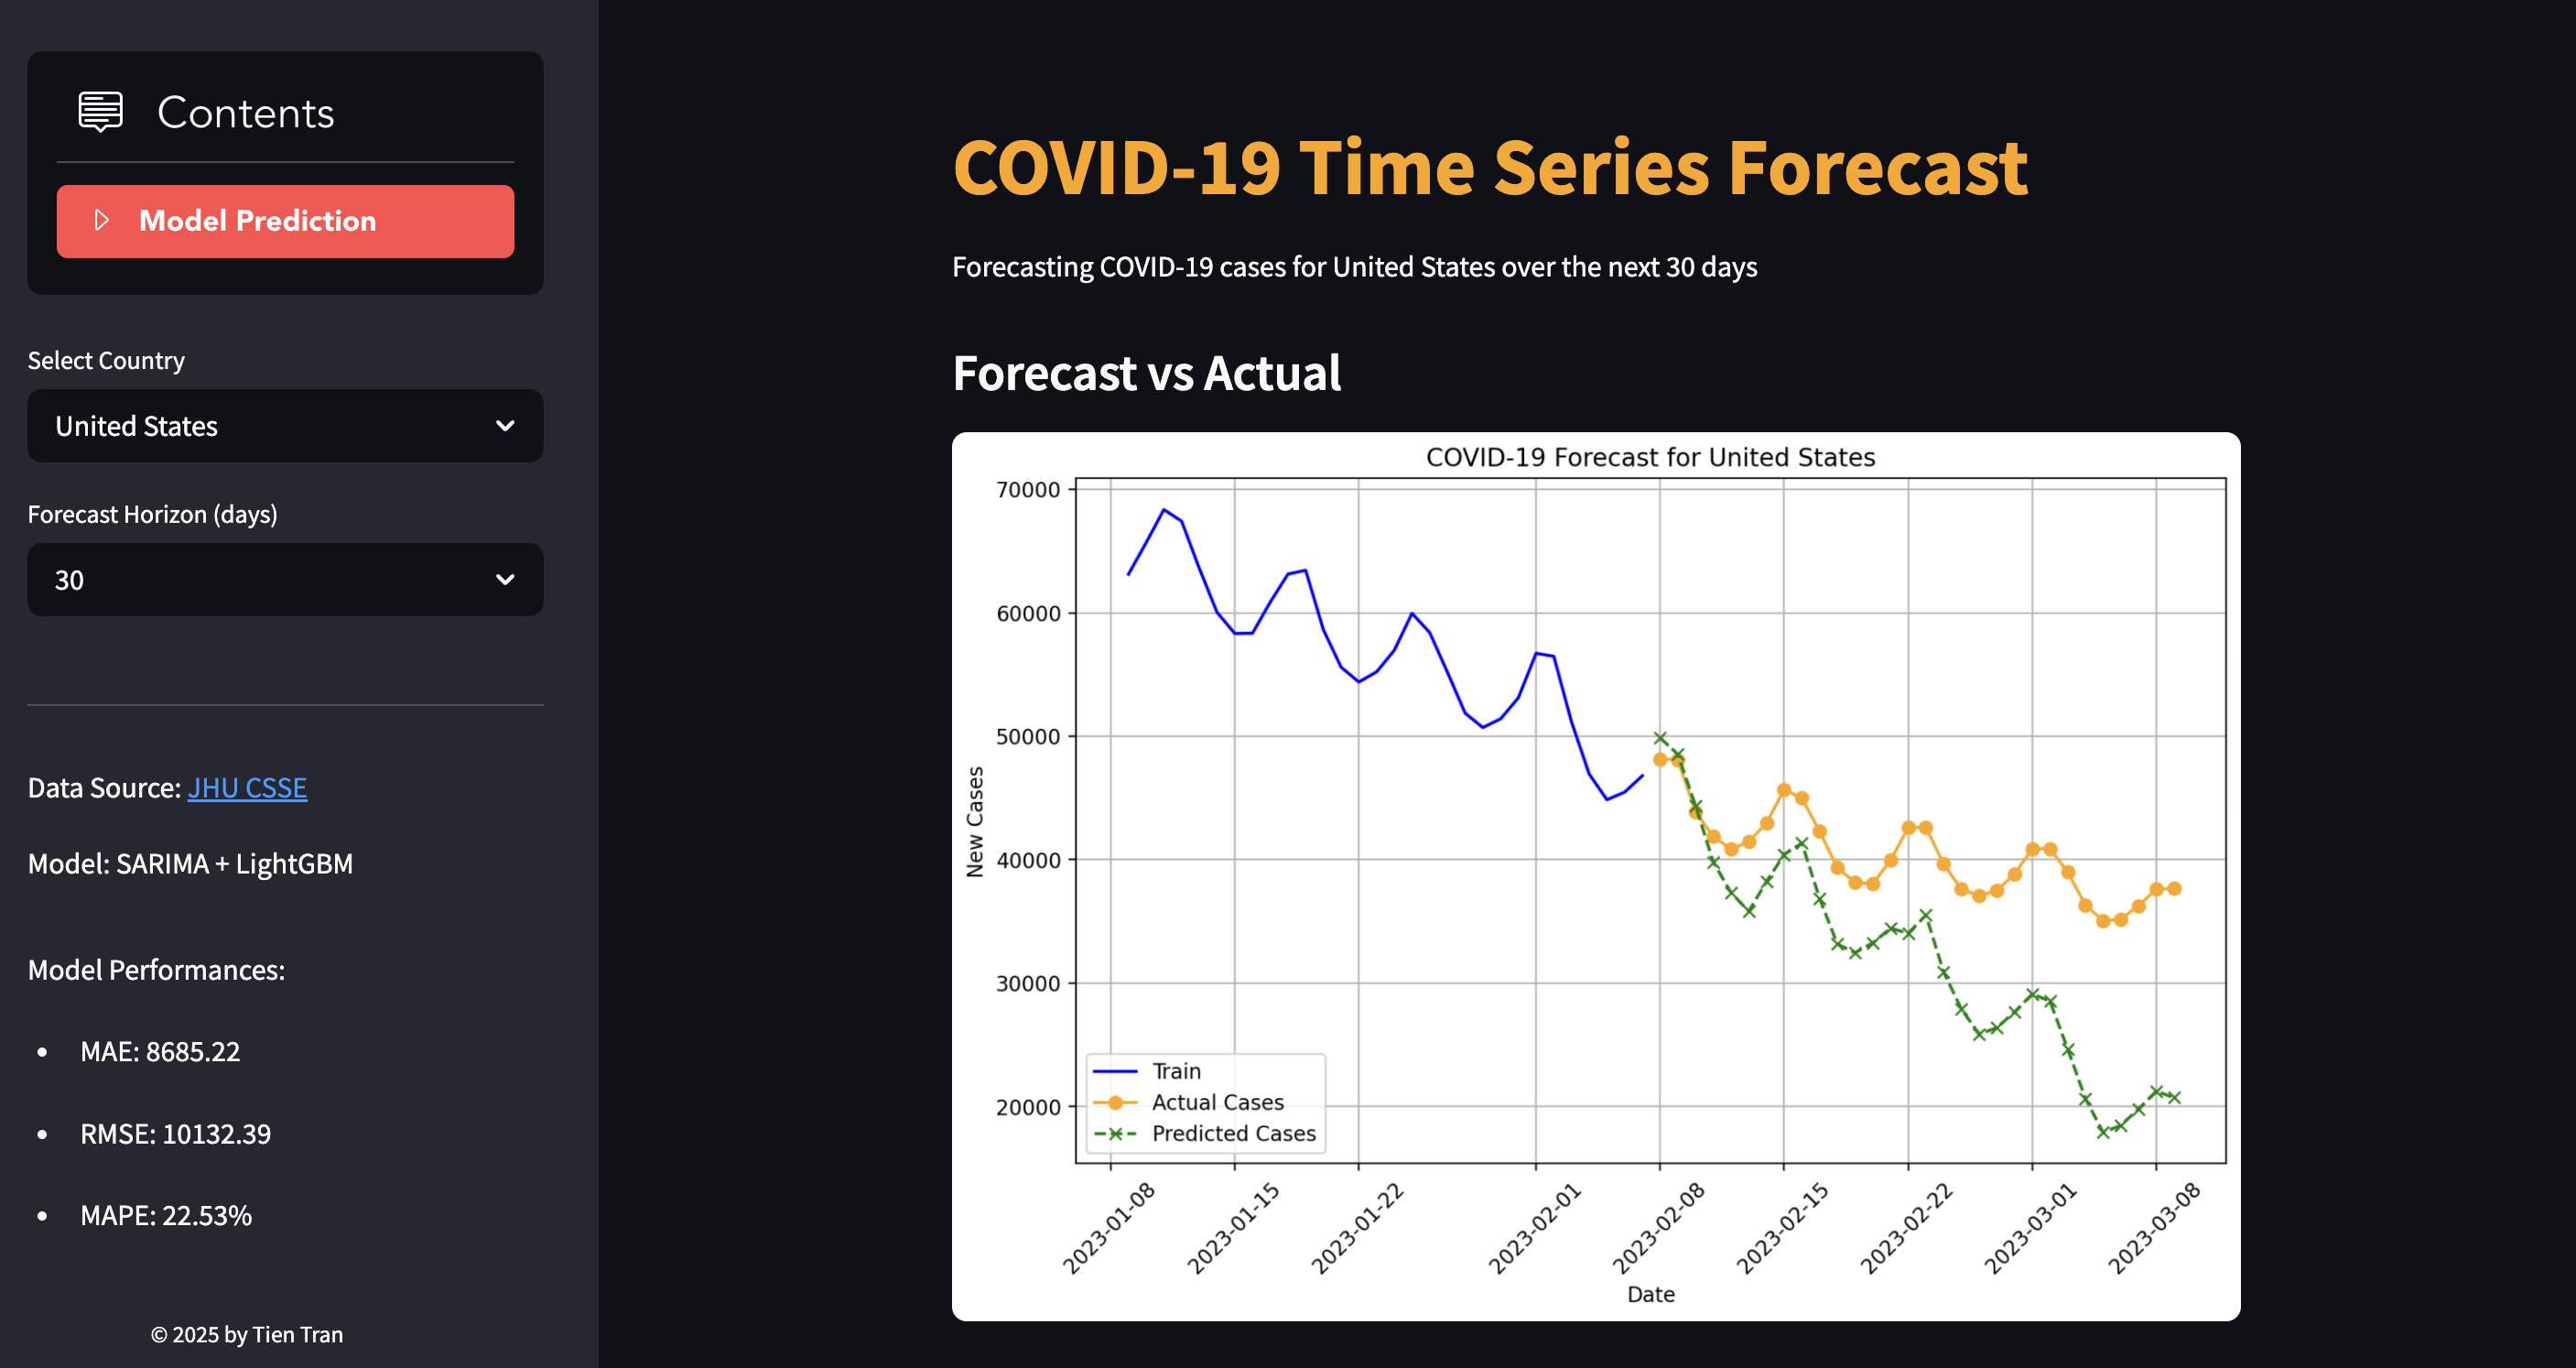
Dropbox for country and forecast horizon selection. Model performances are displayed on sidebar